BACKSELECTED WORKS
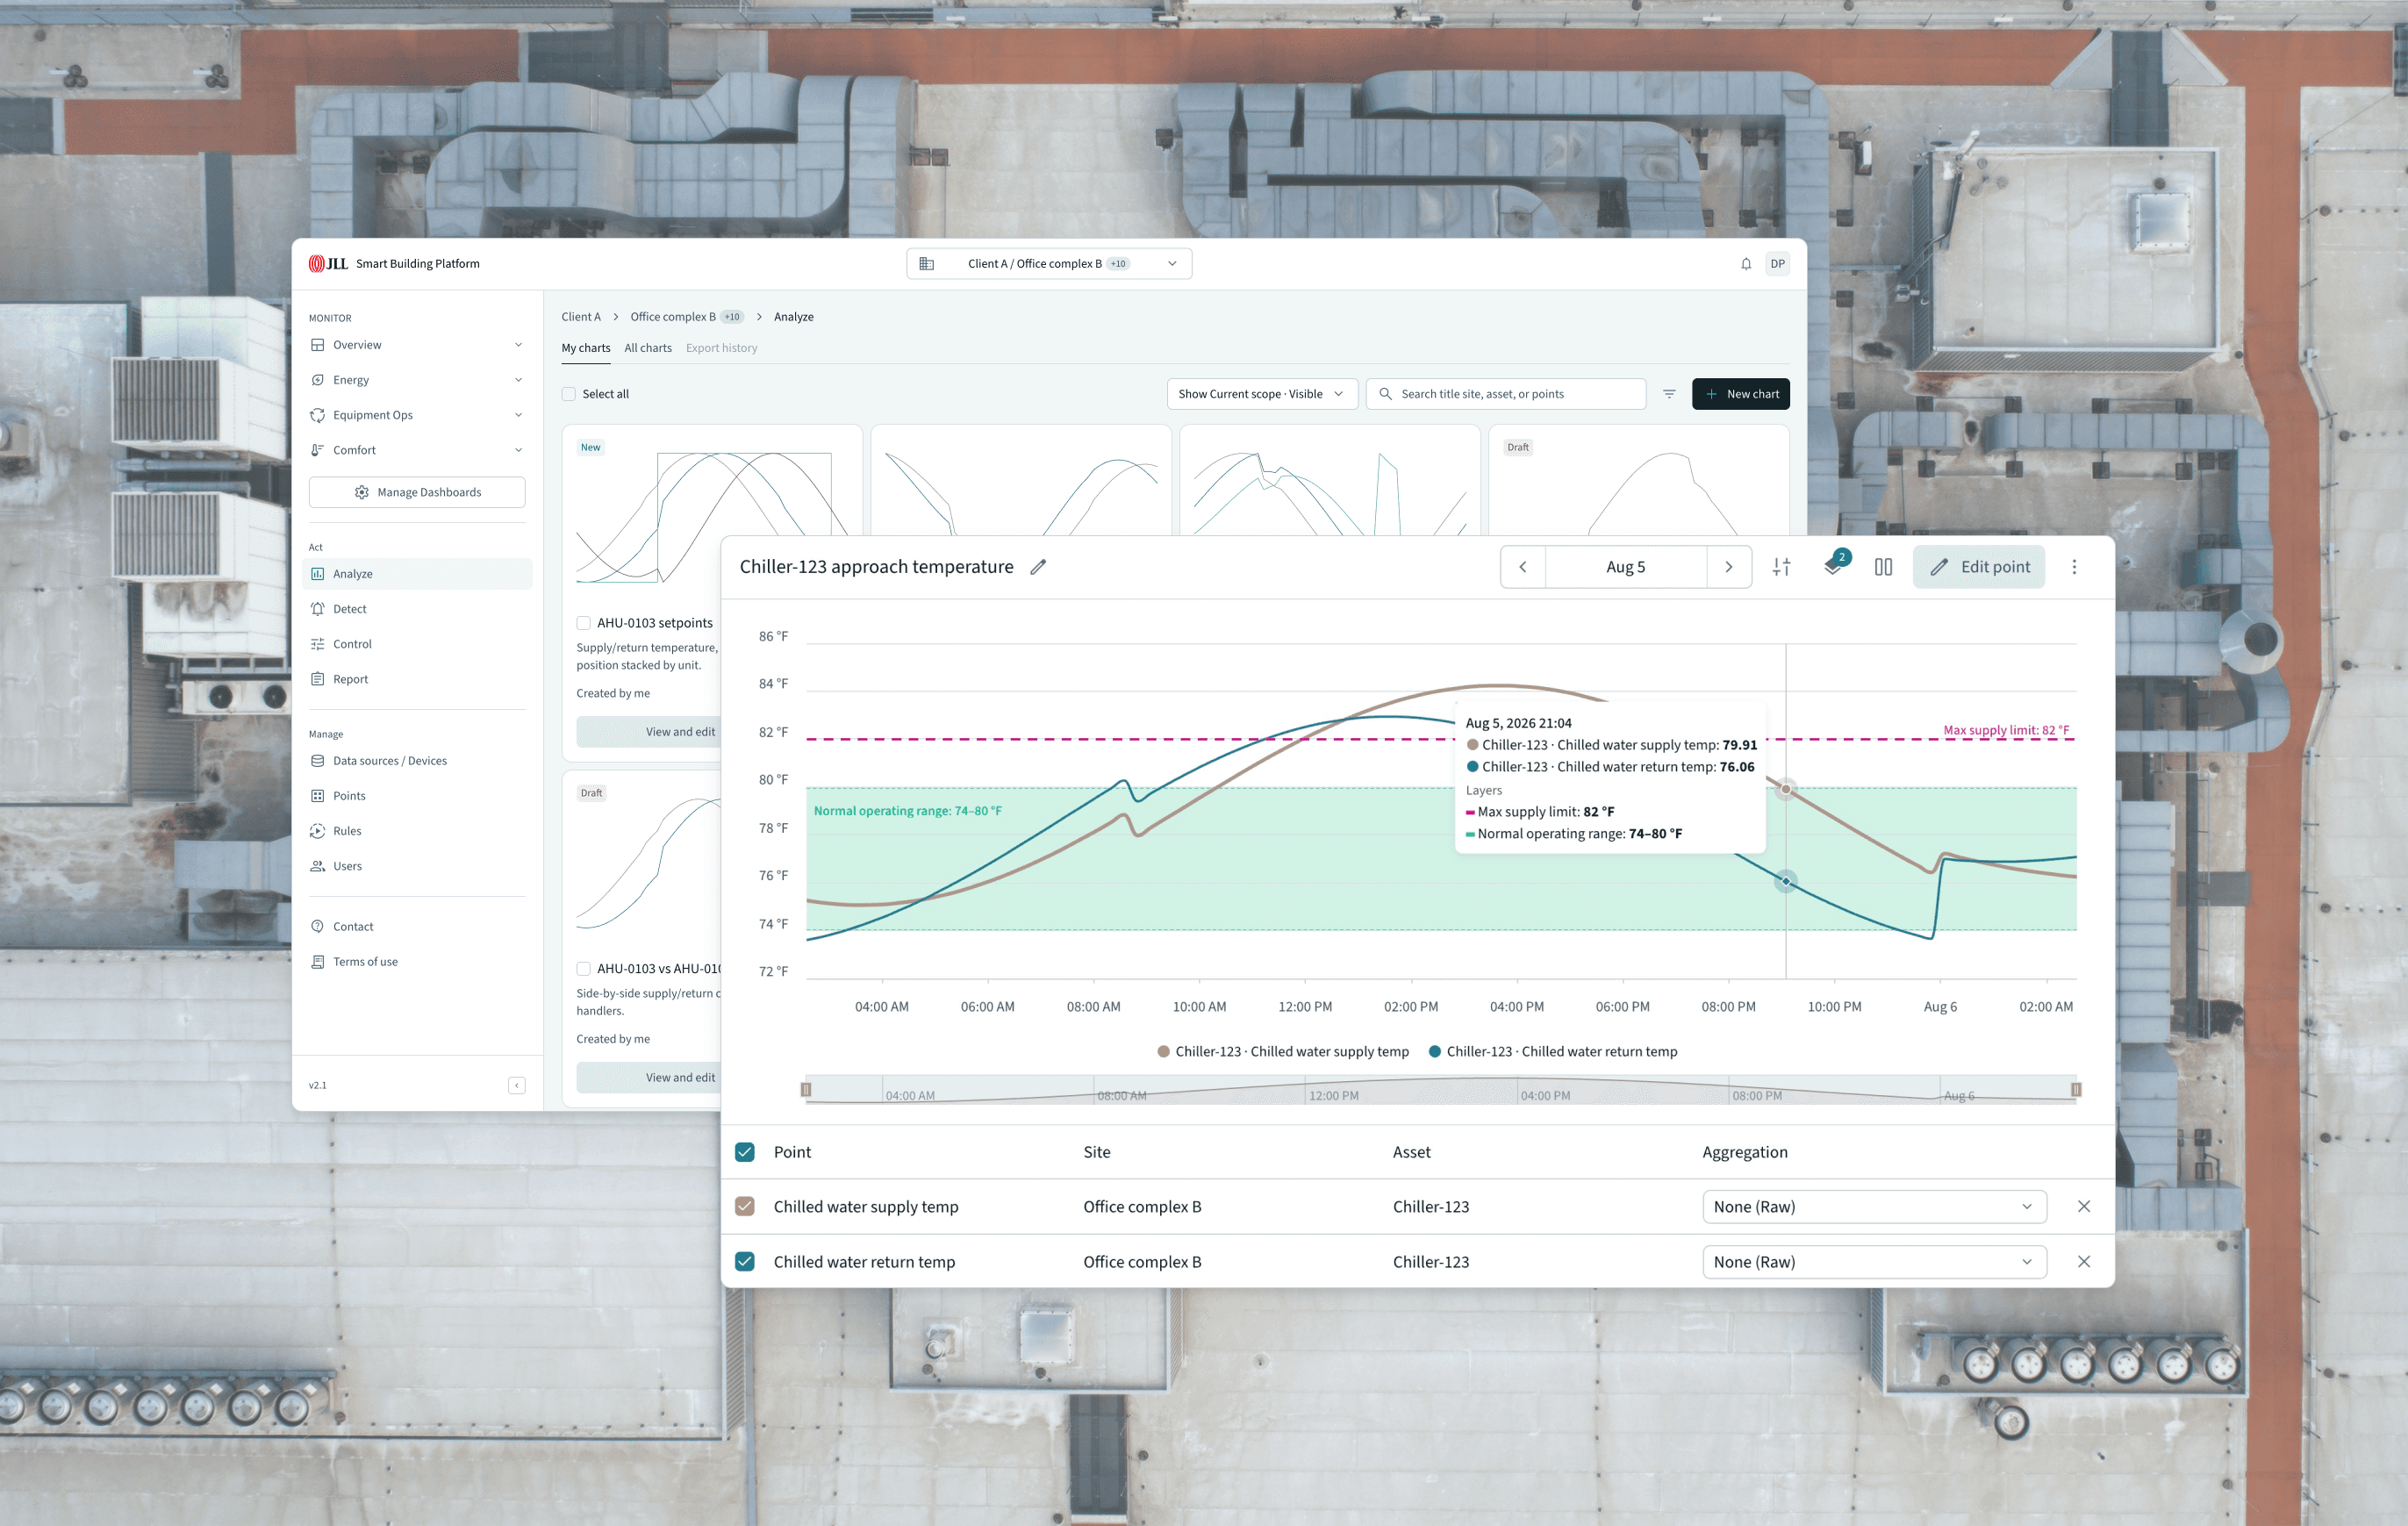
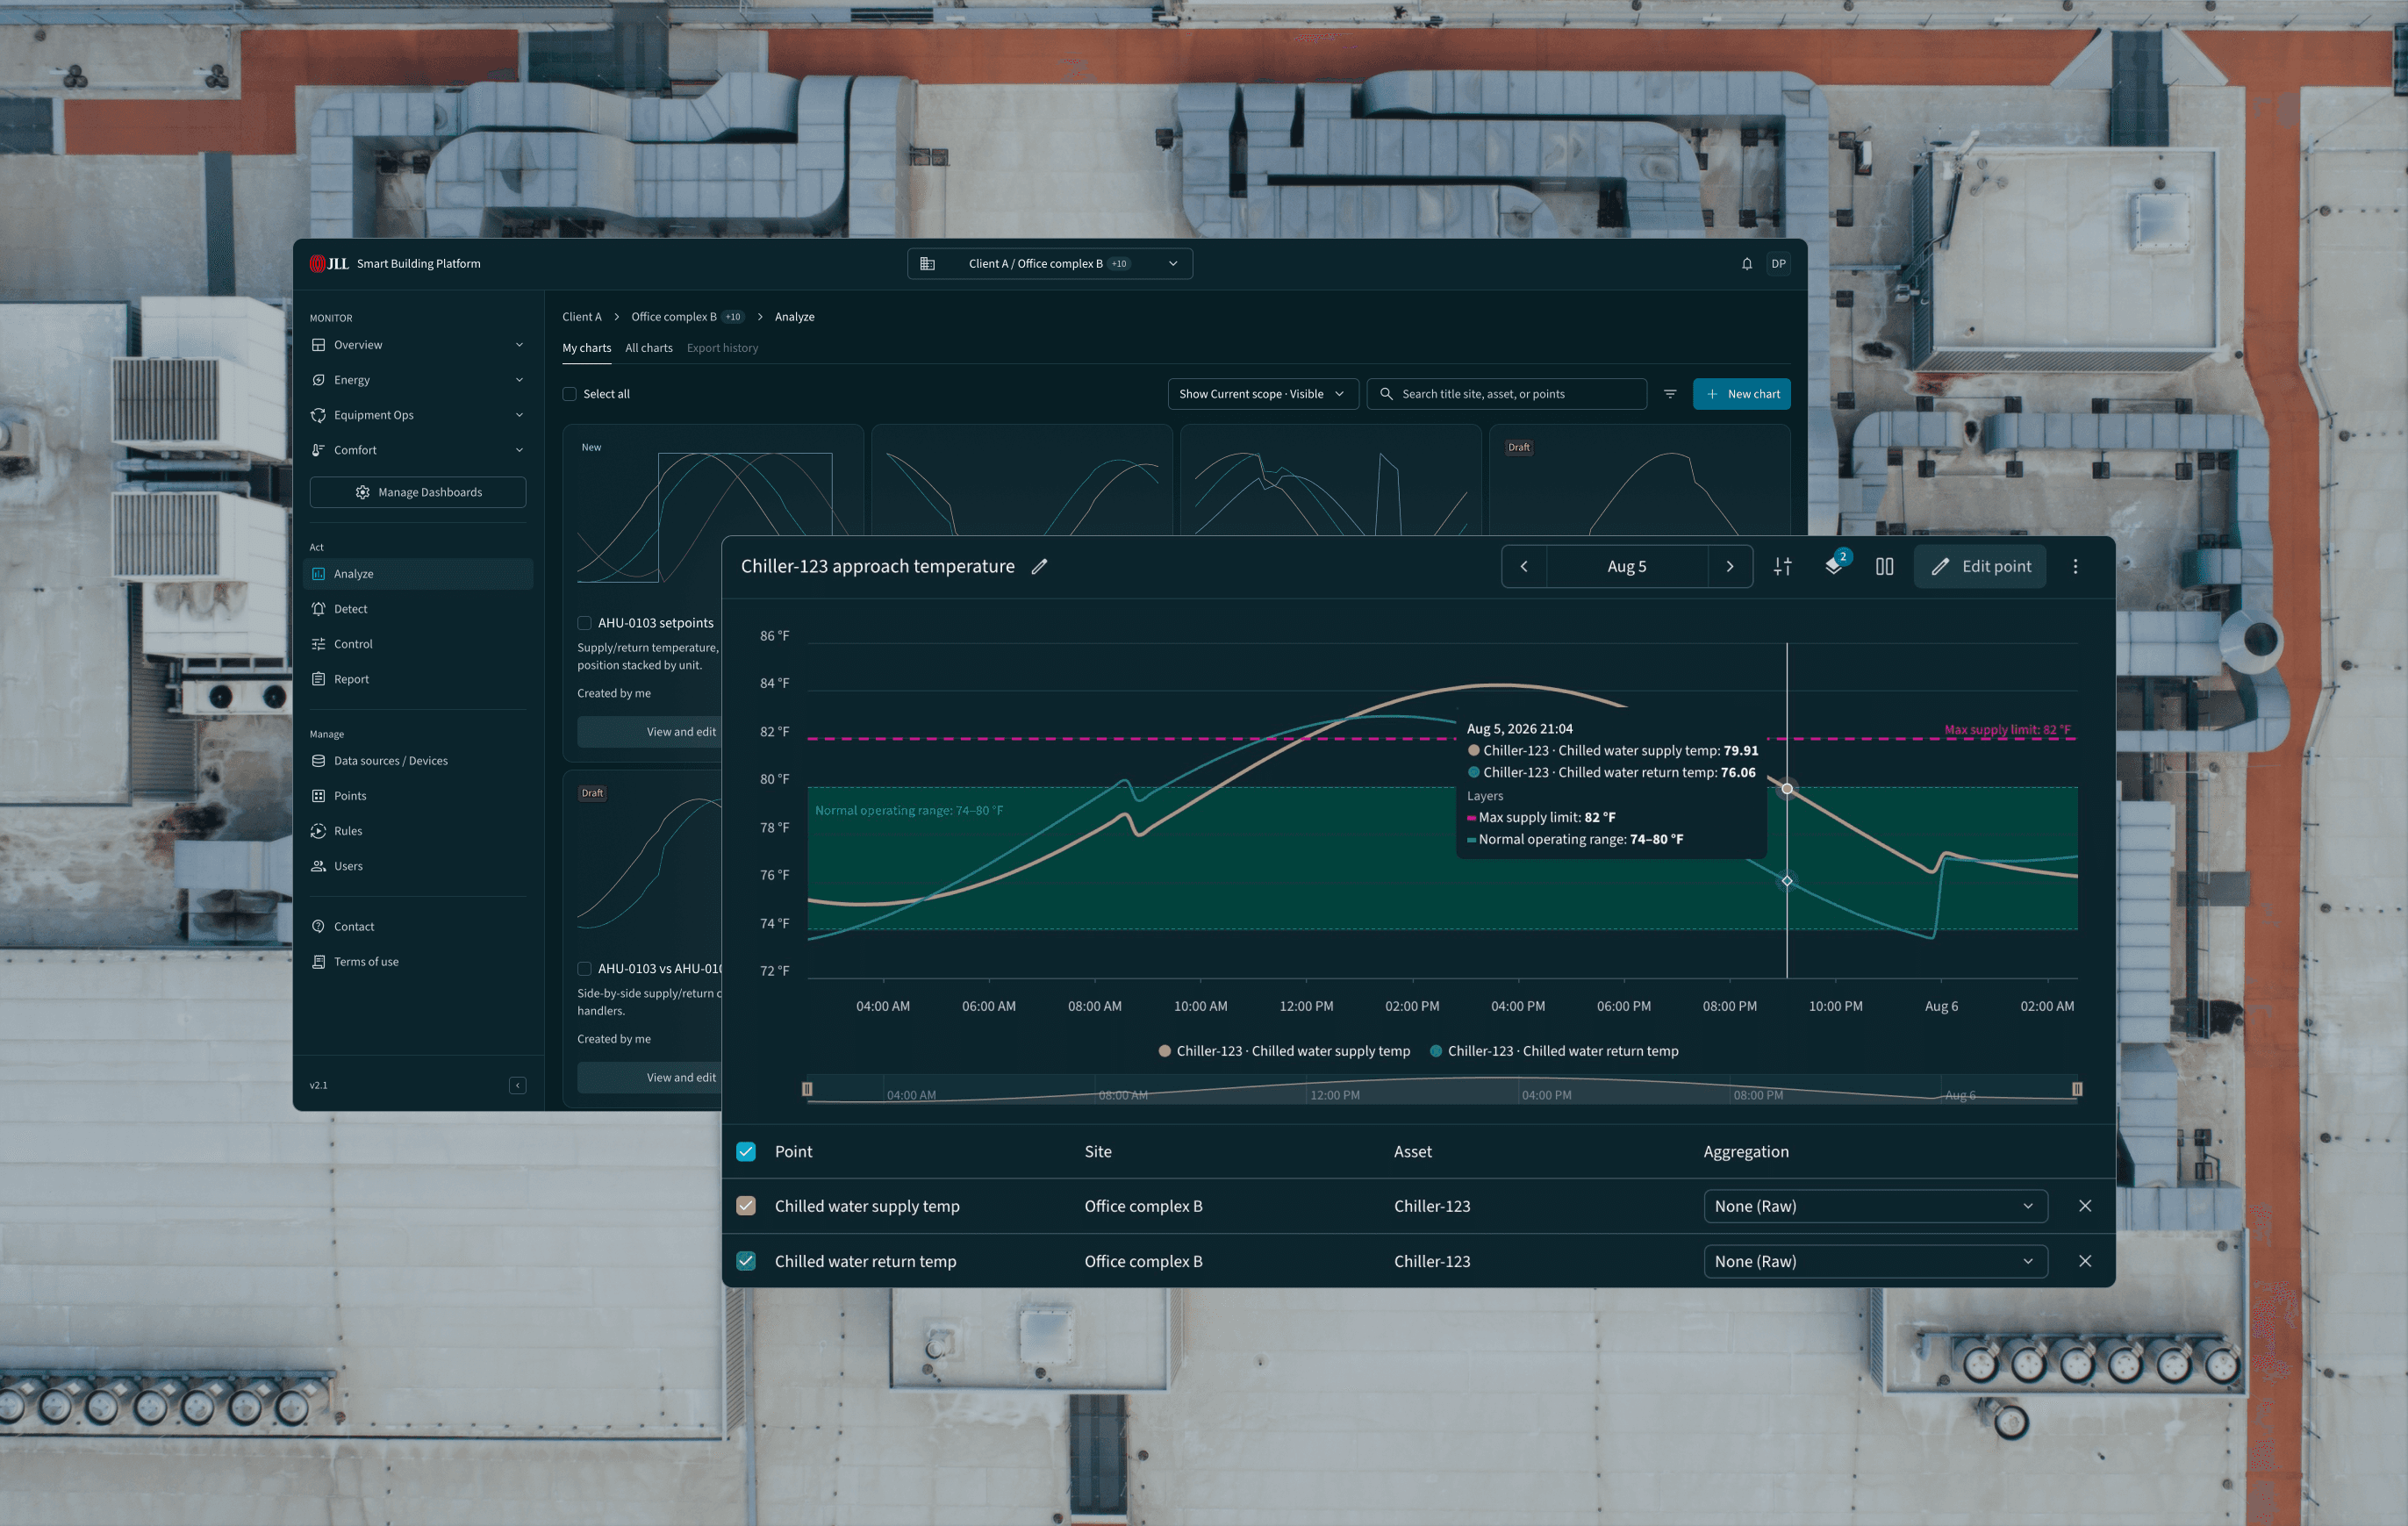
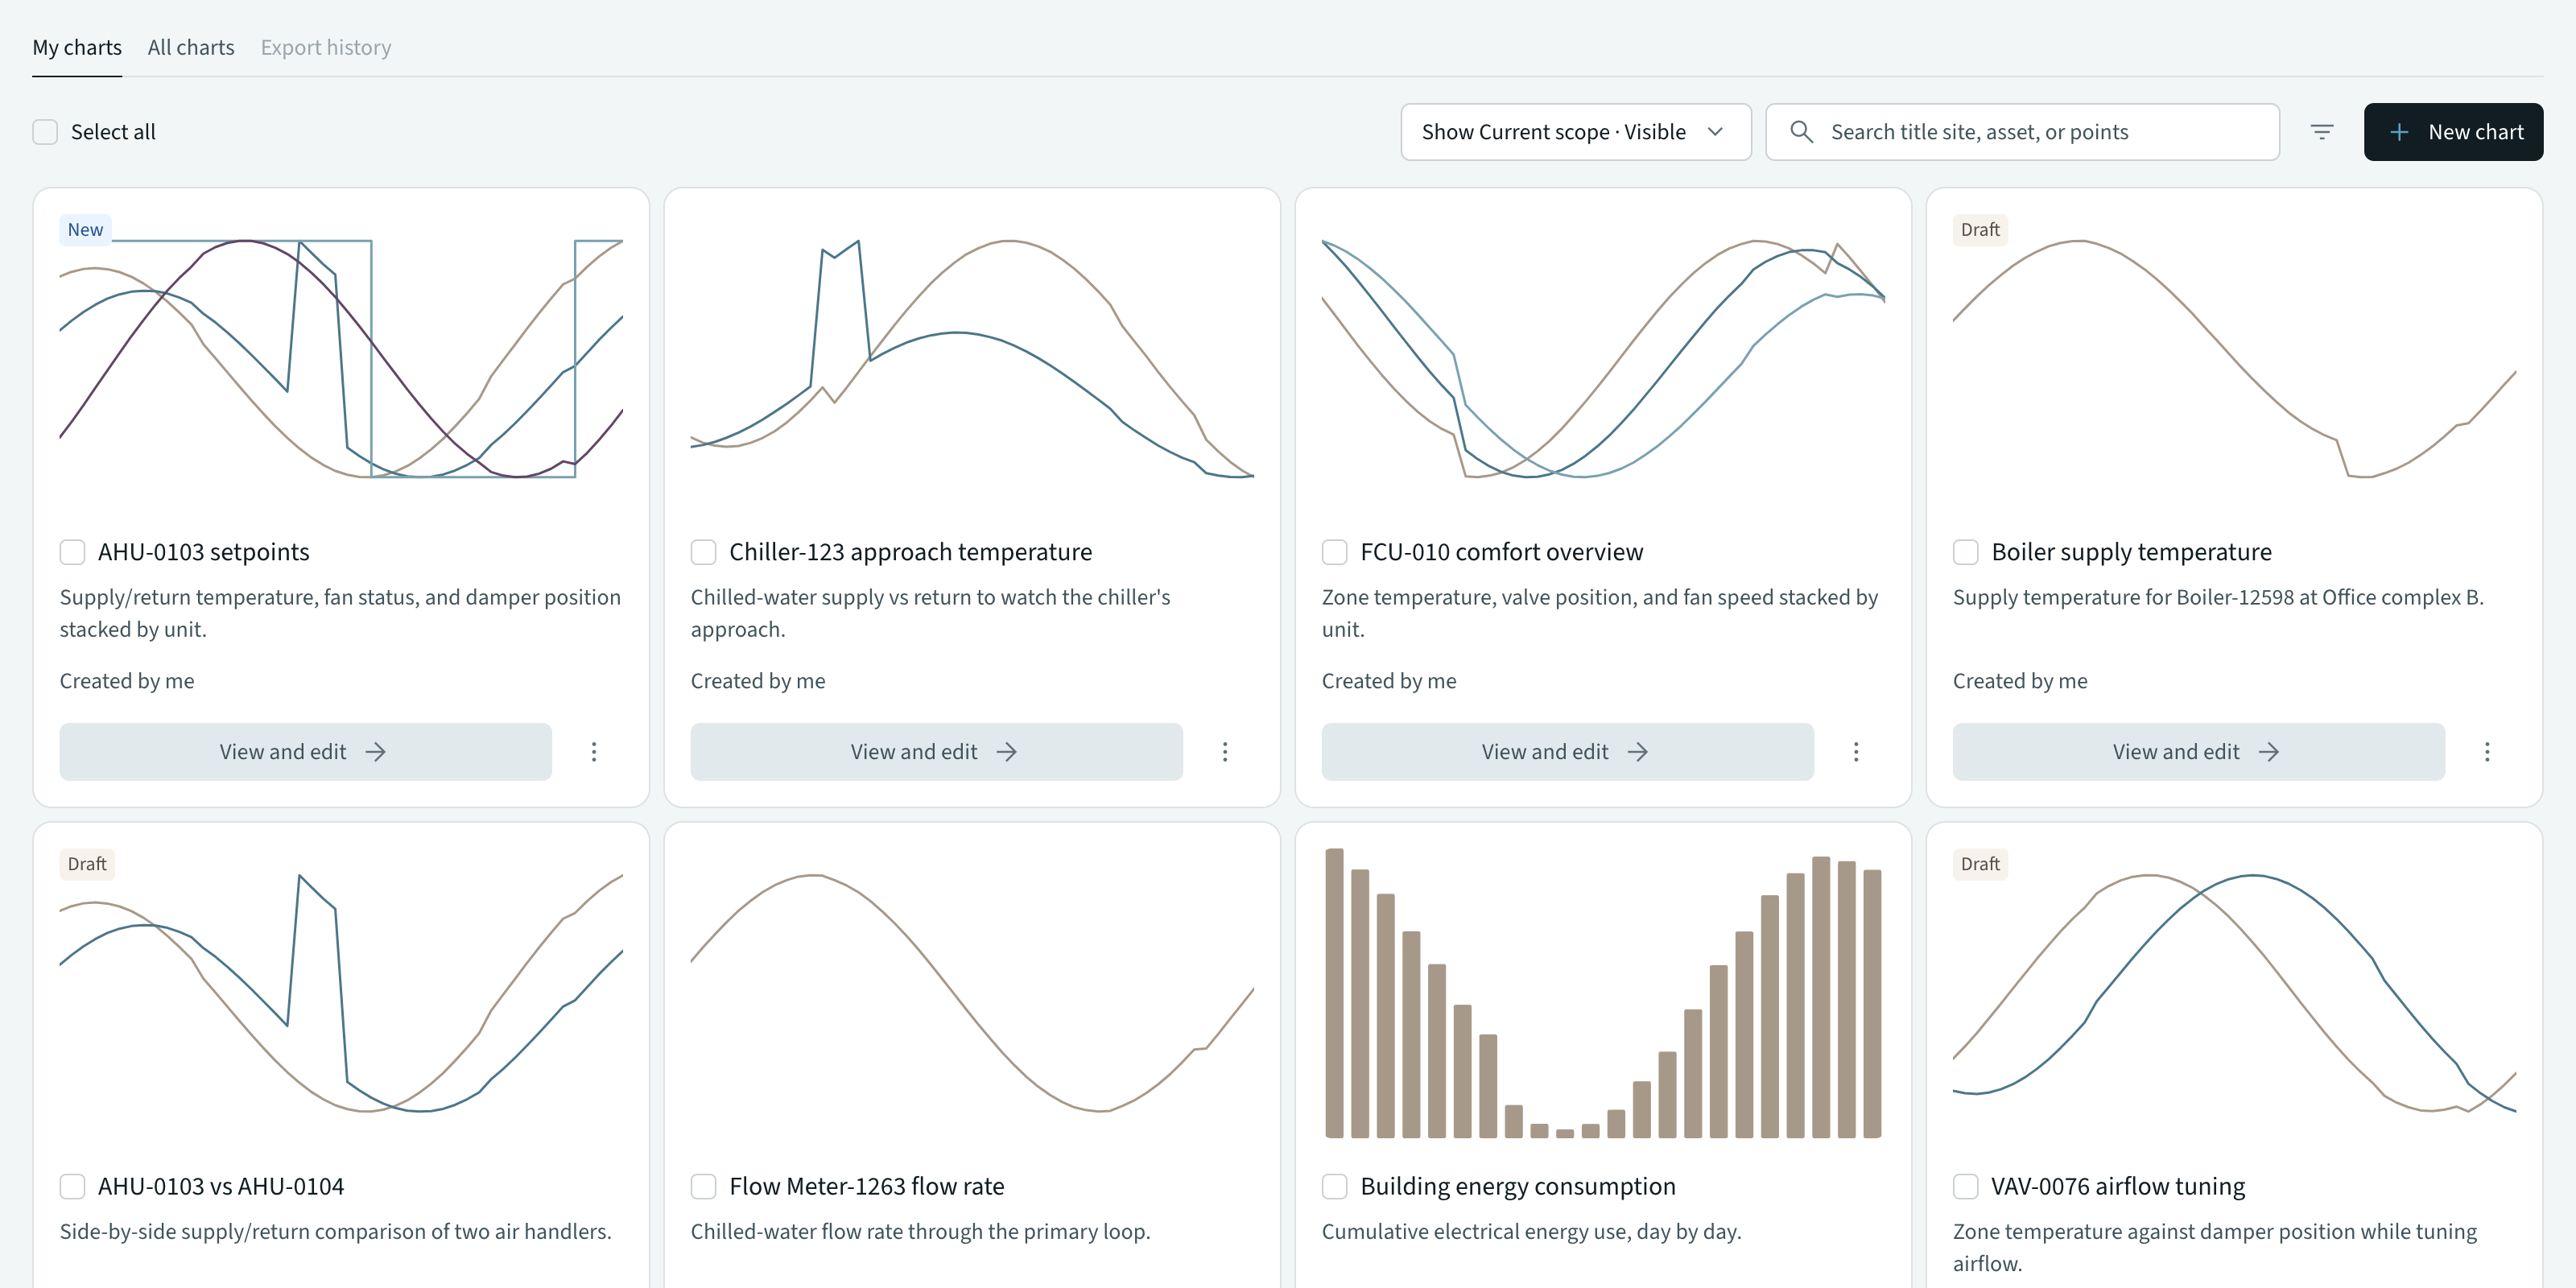
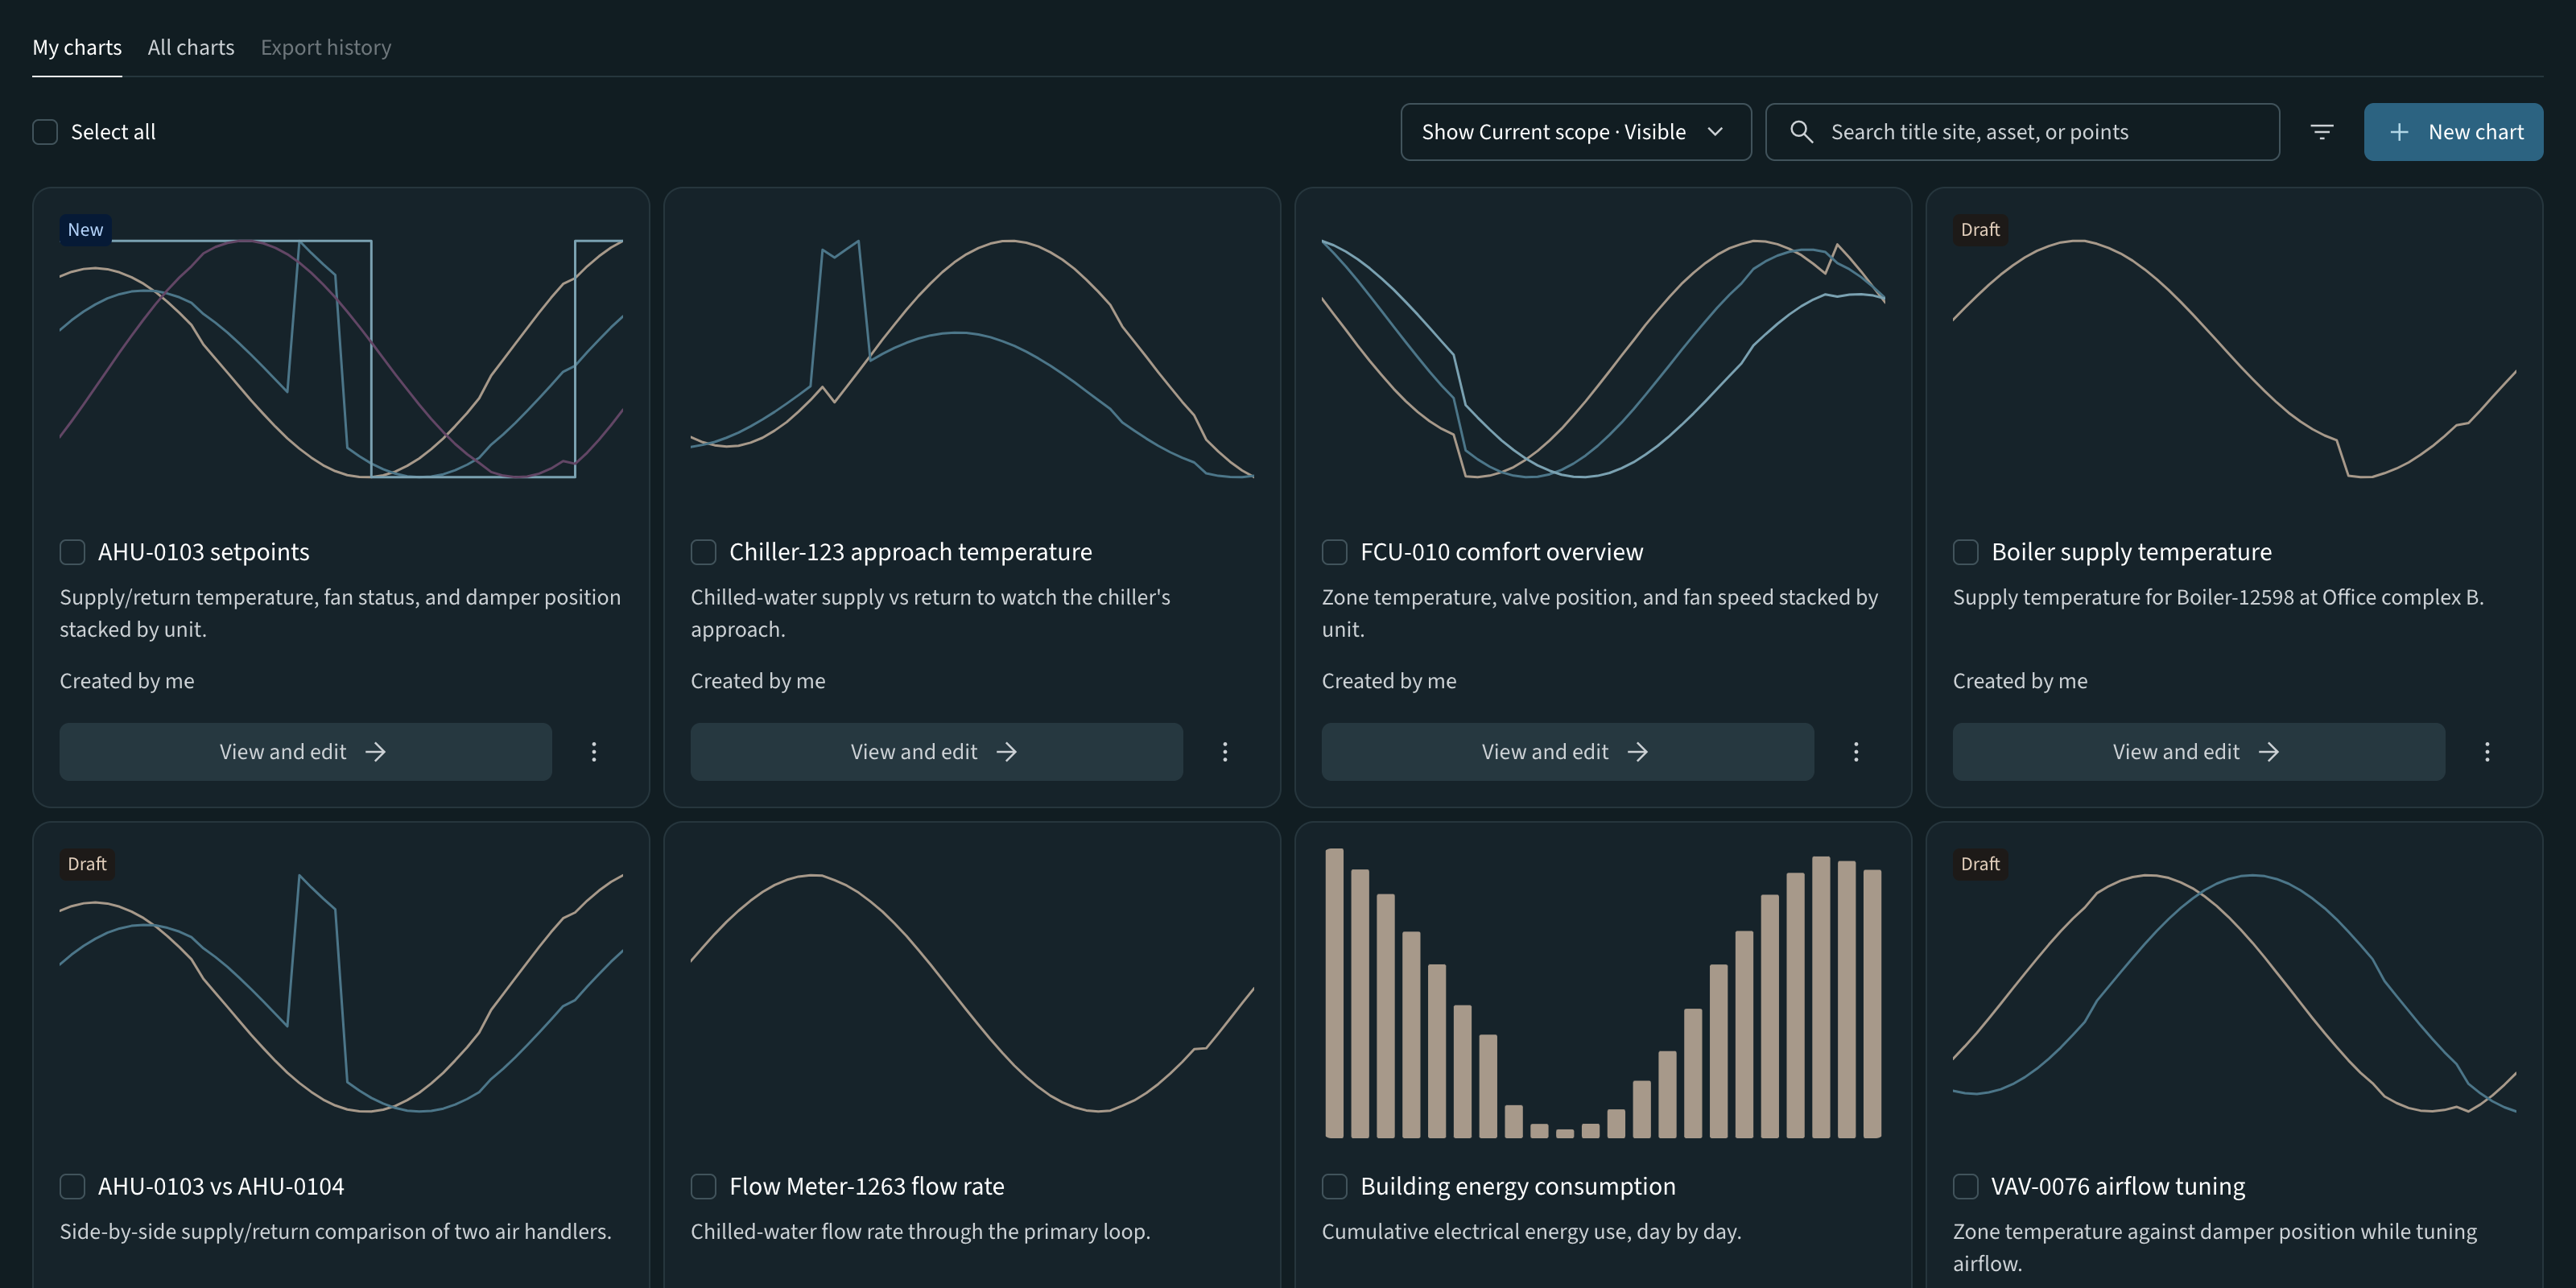
Graph Builder chart workspace
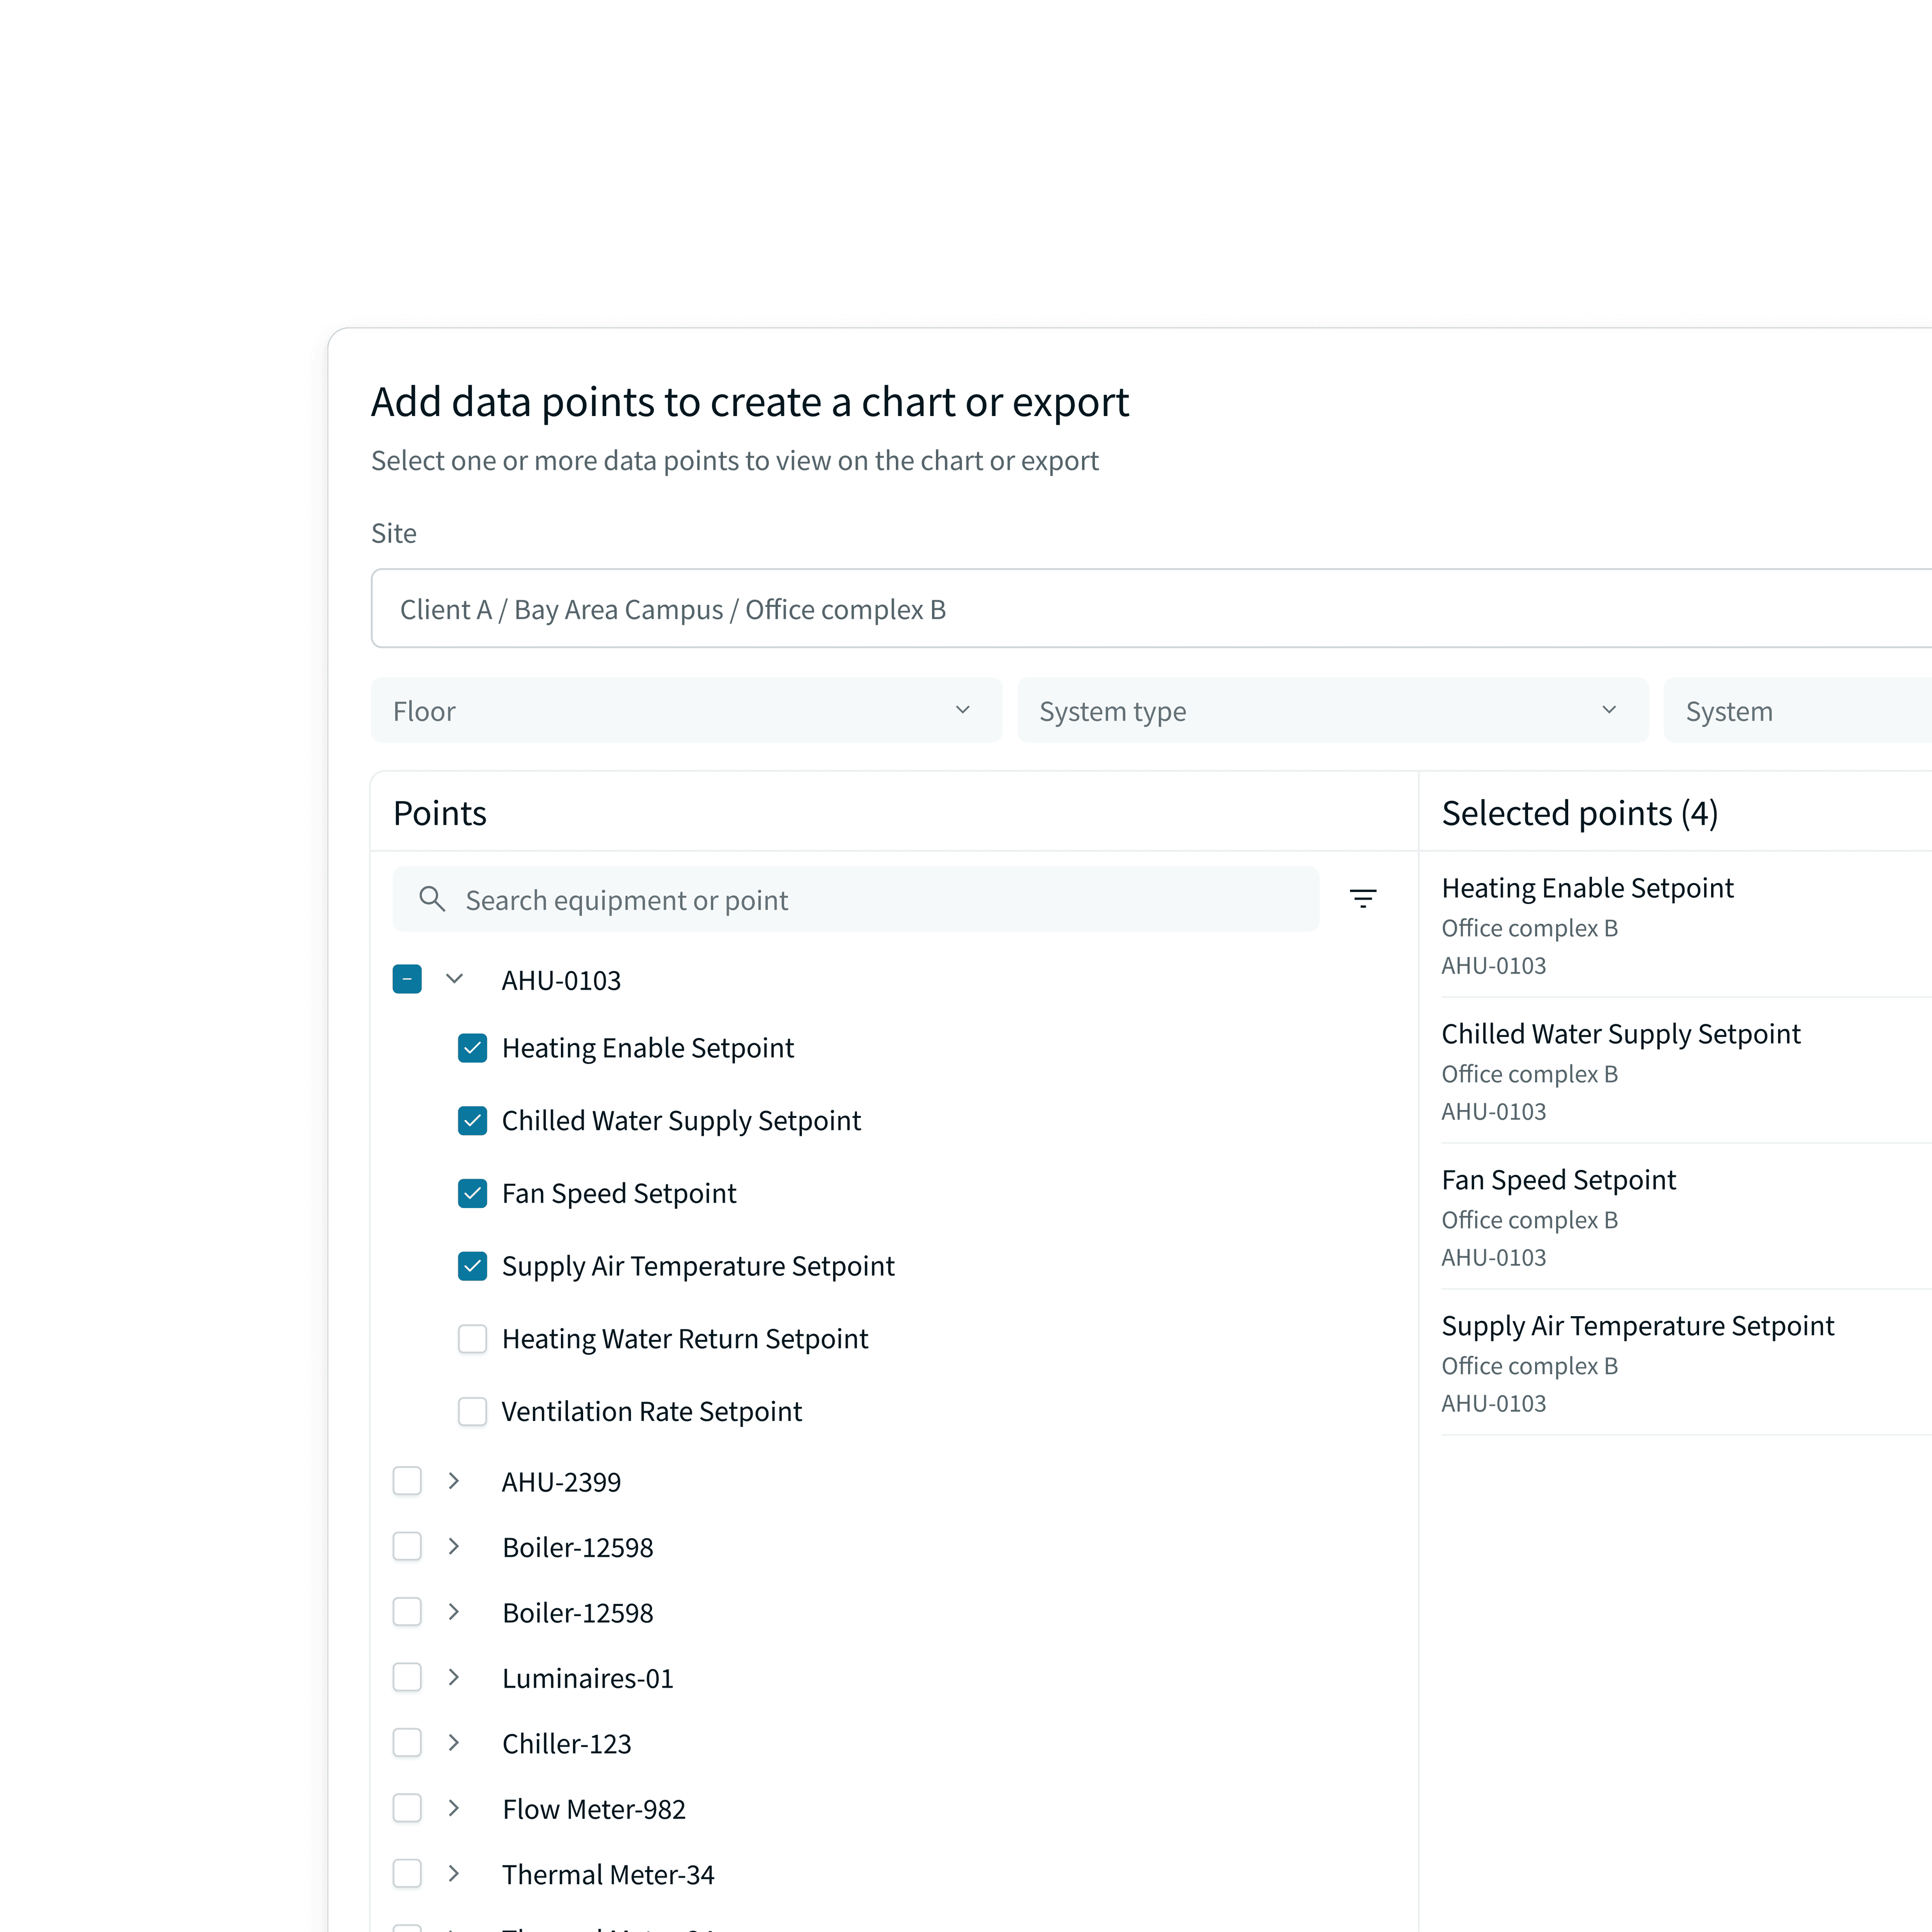
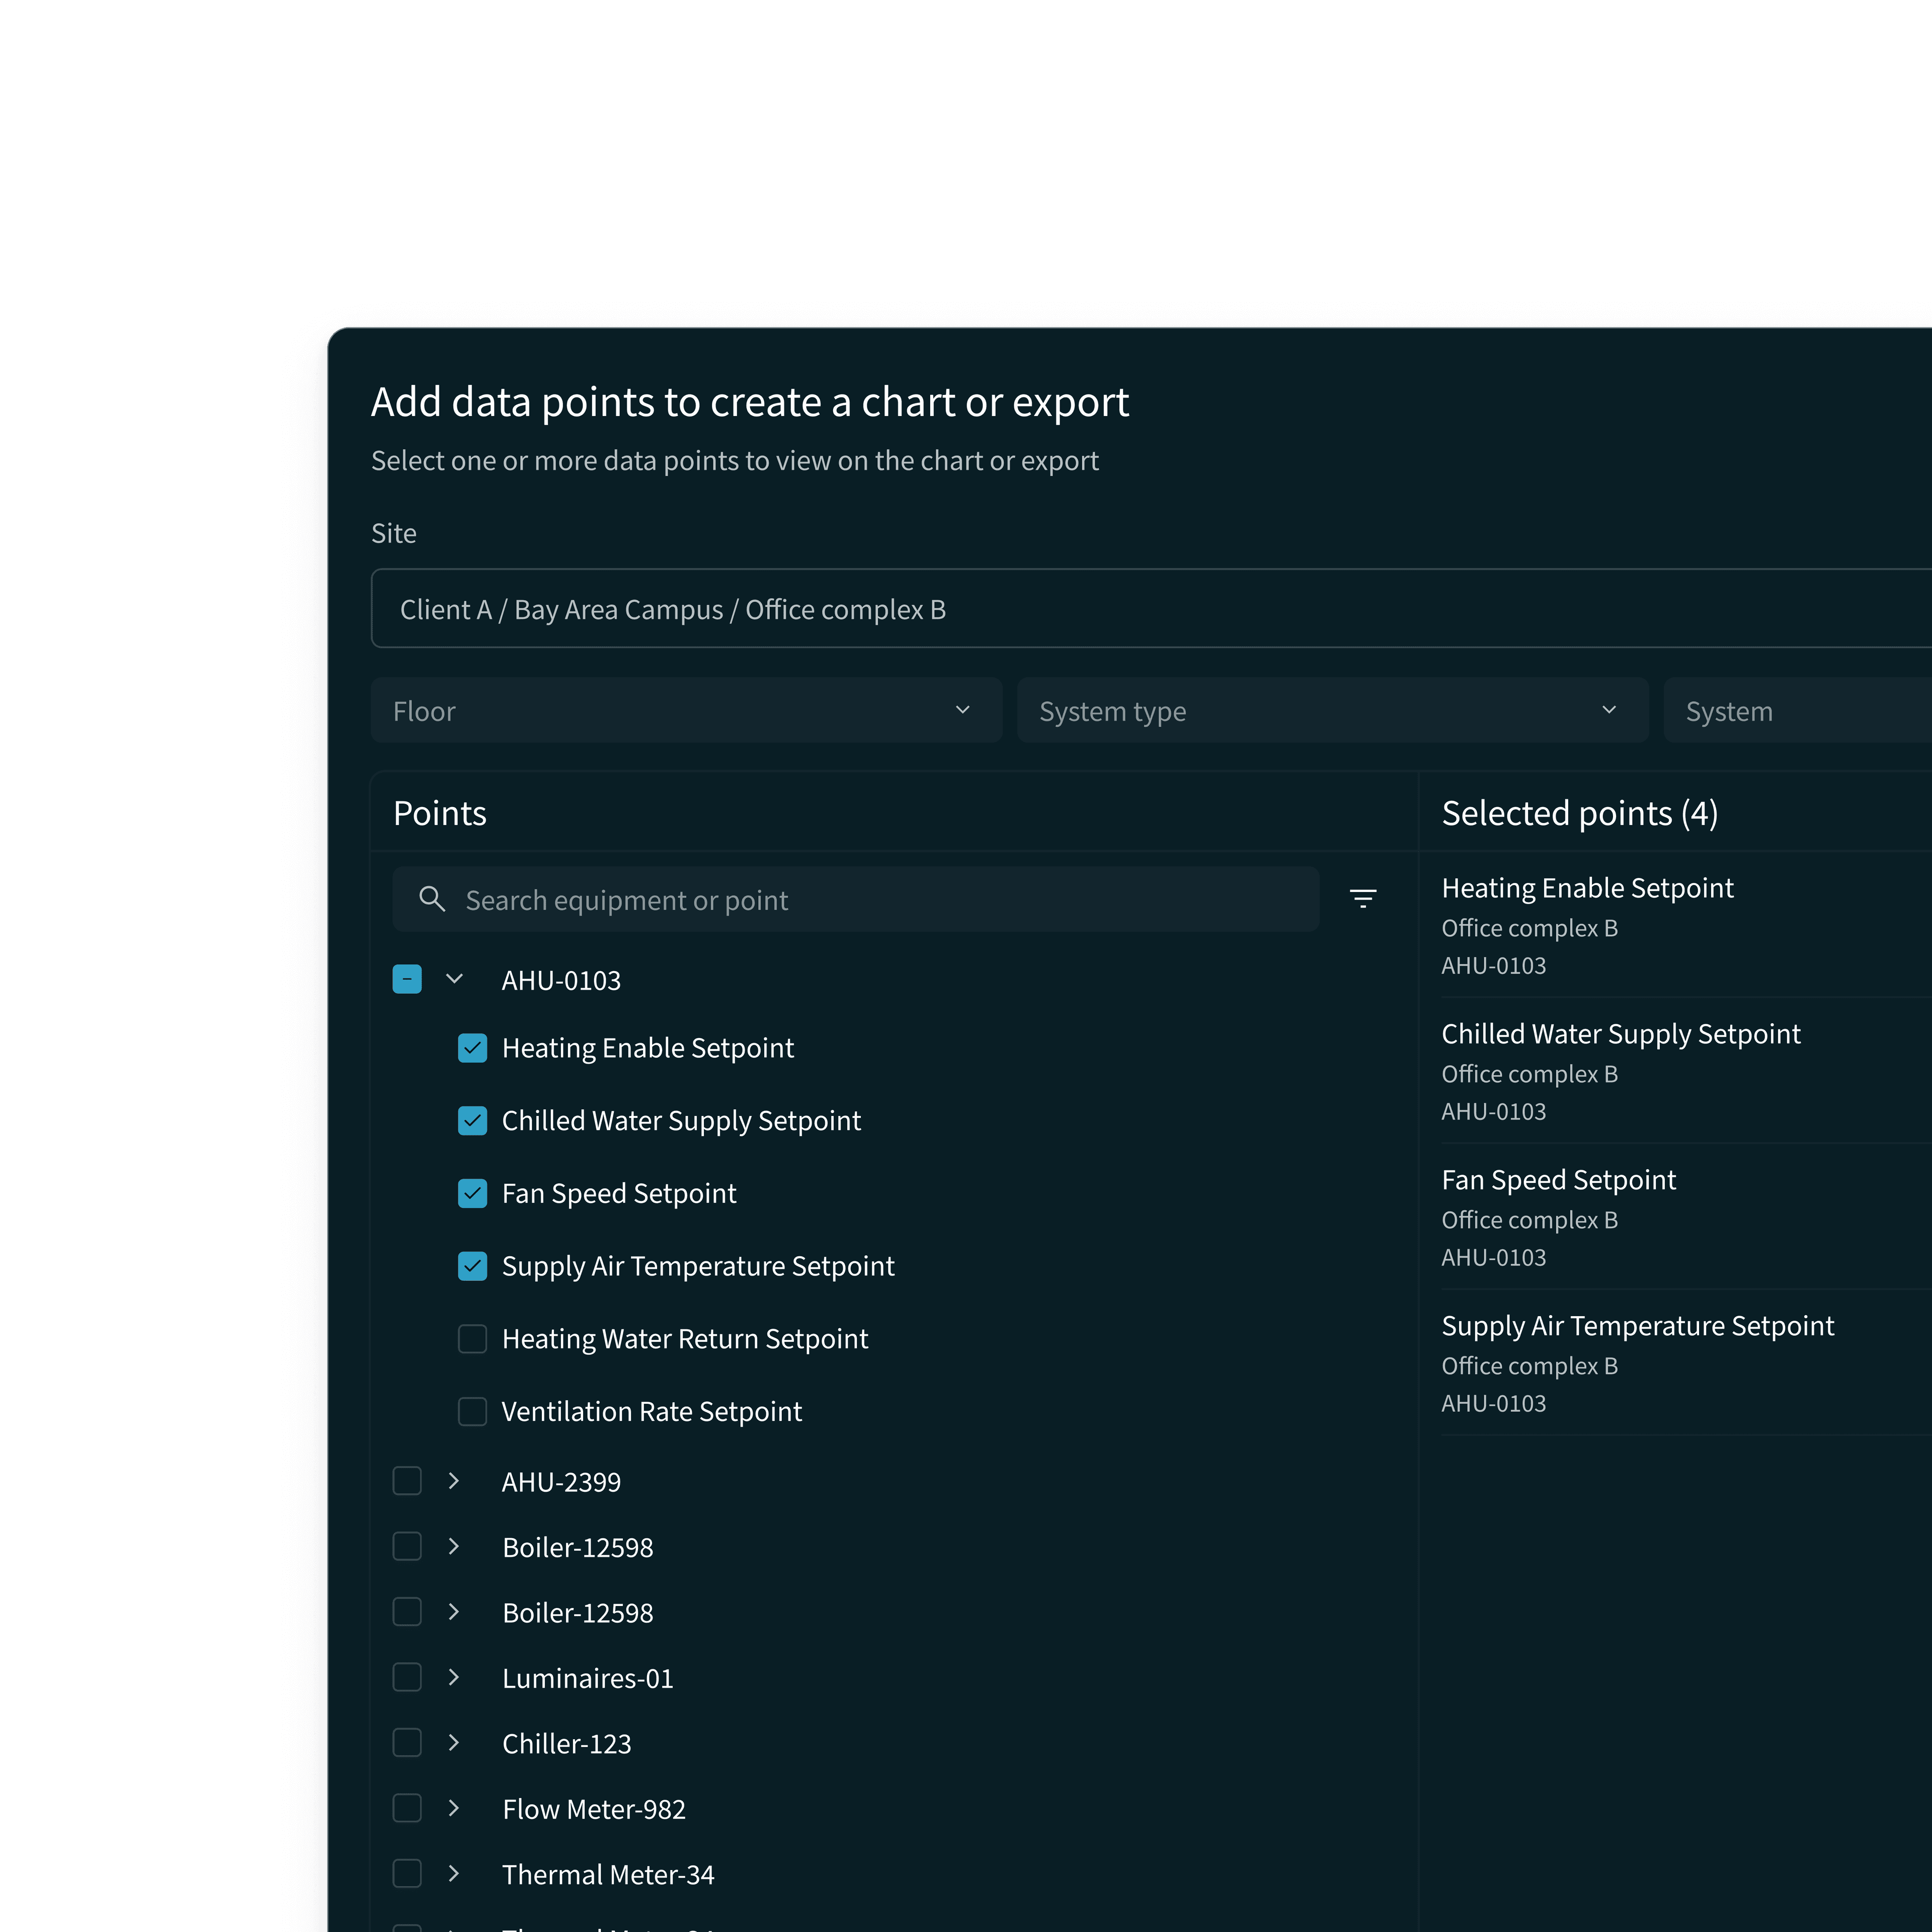
Graph Builder data point selection

Point Browser

Search and select equipment points, then add them to a chart or export.

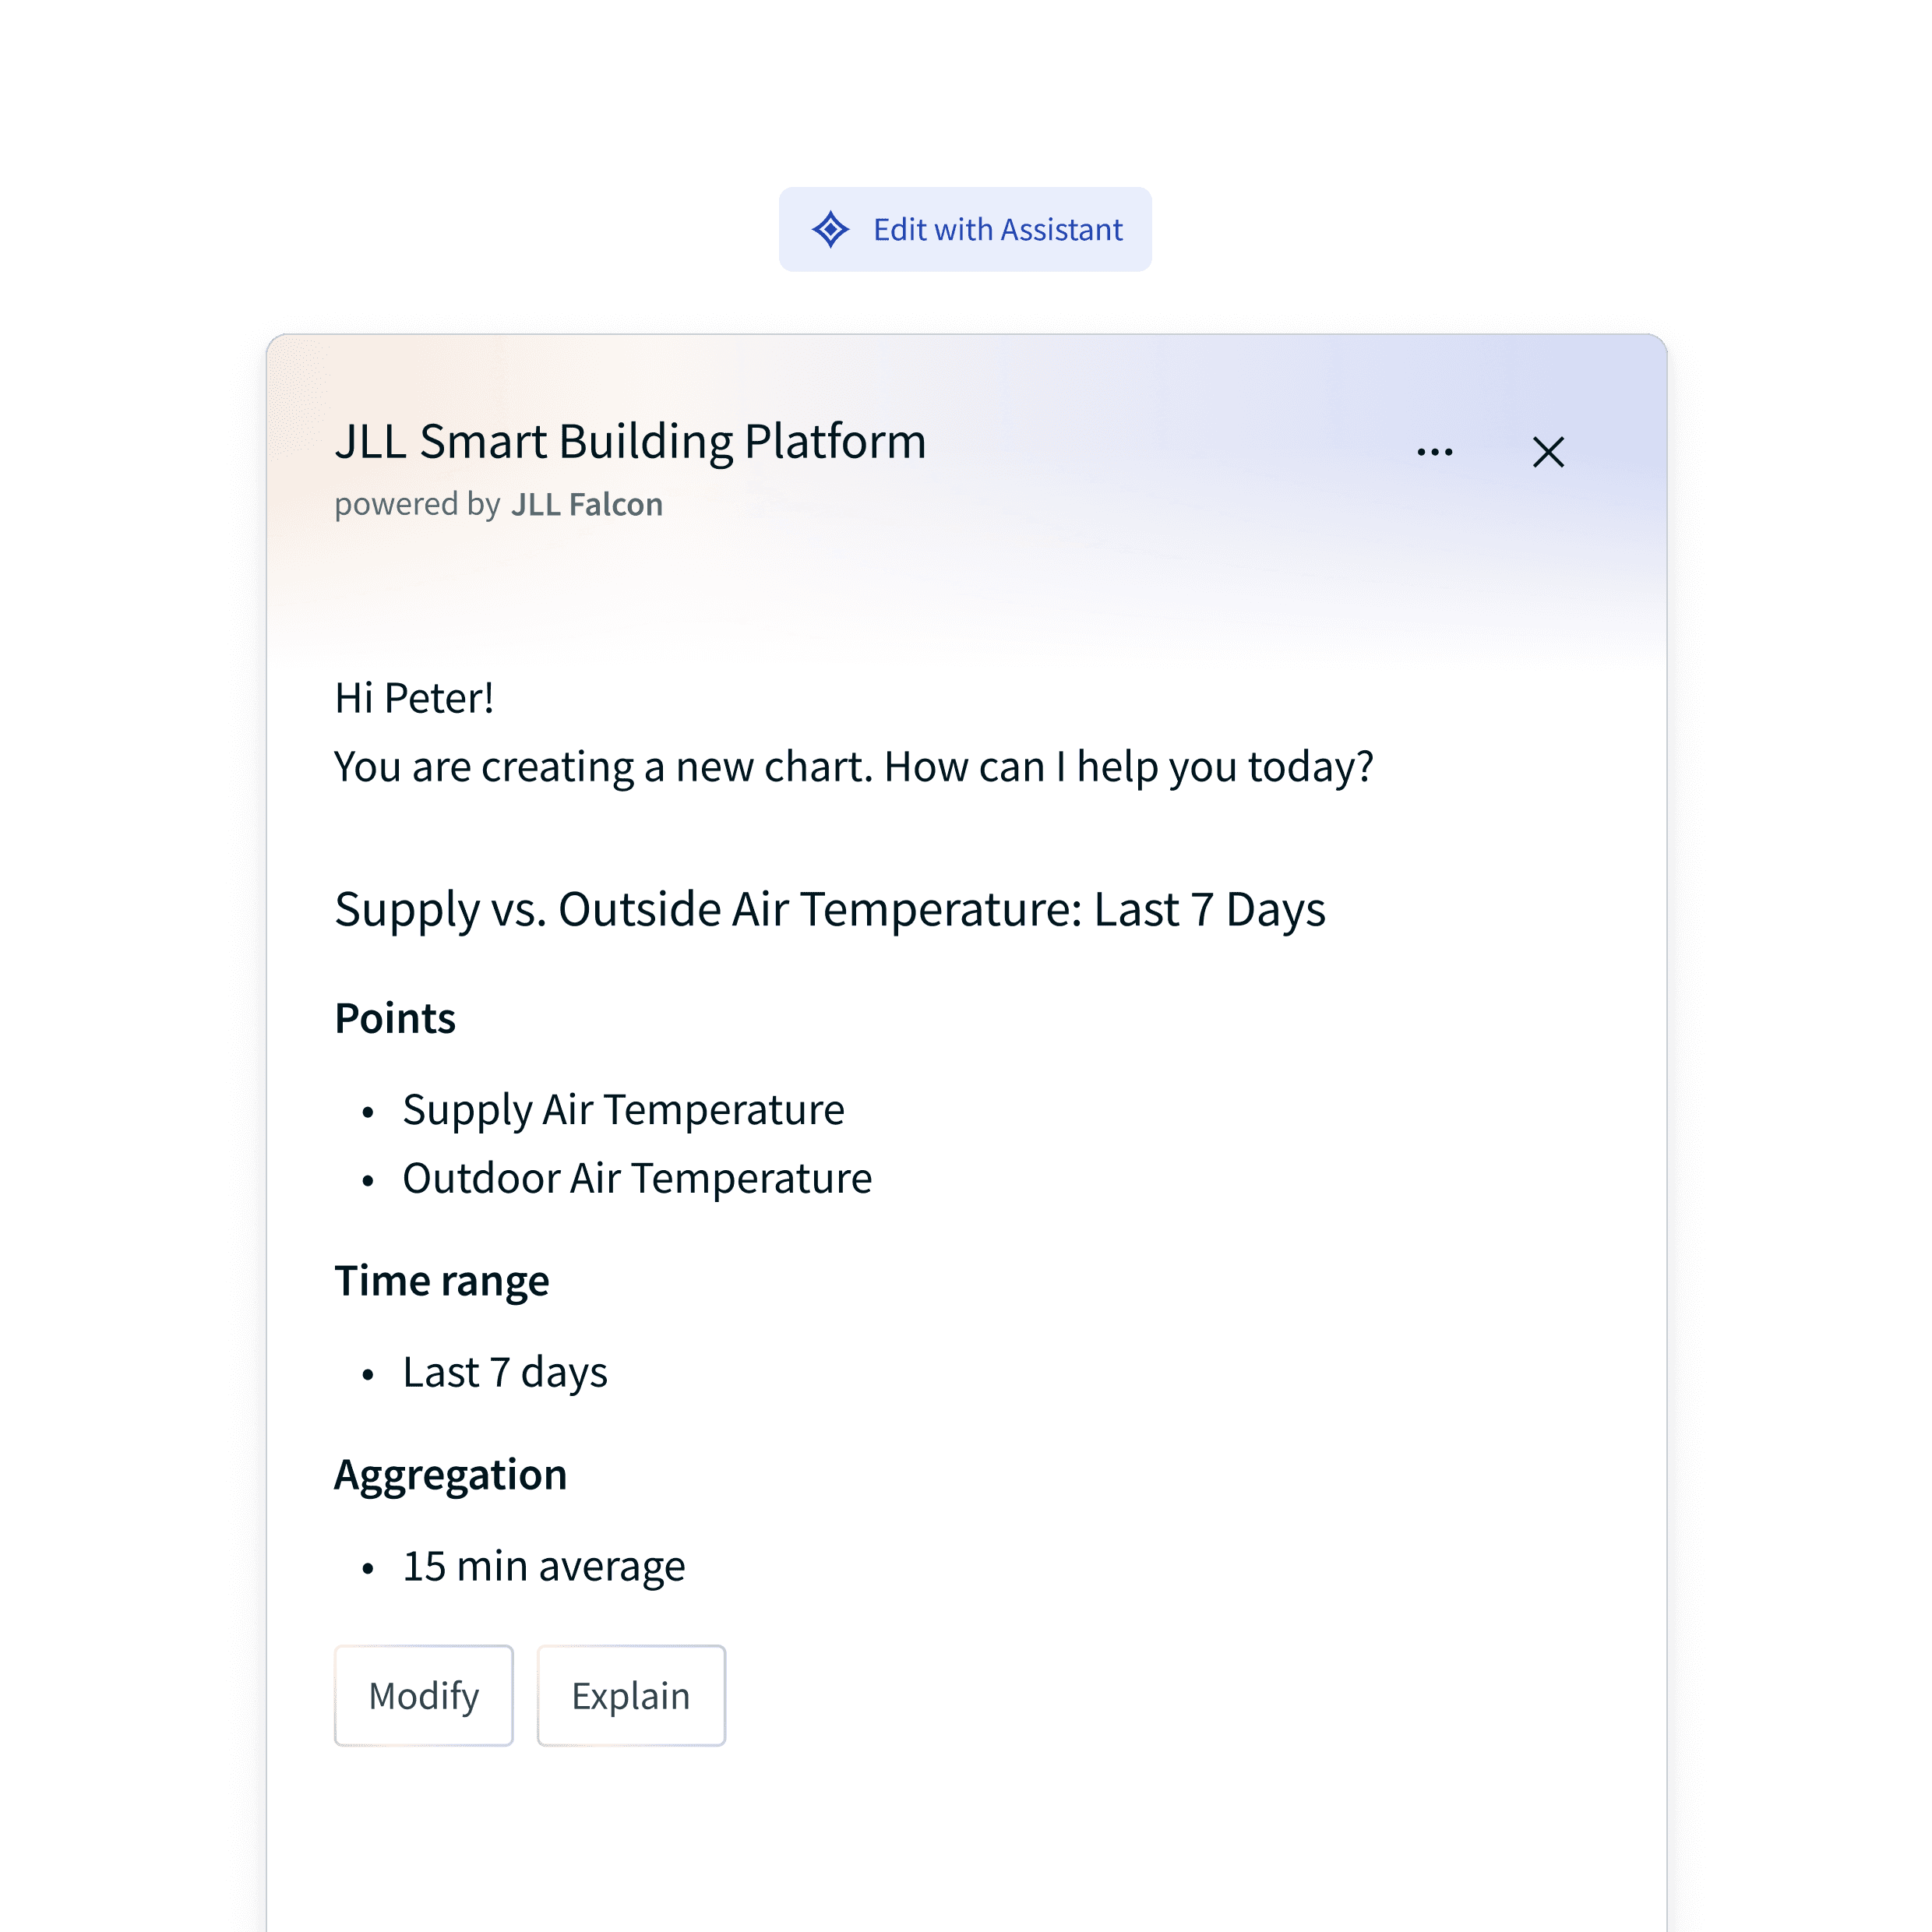
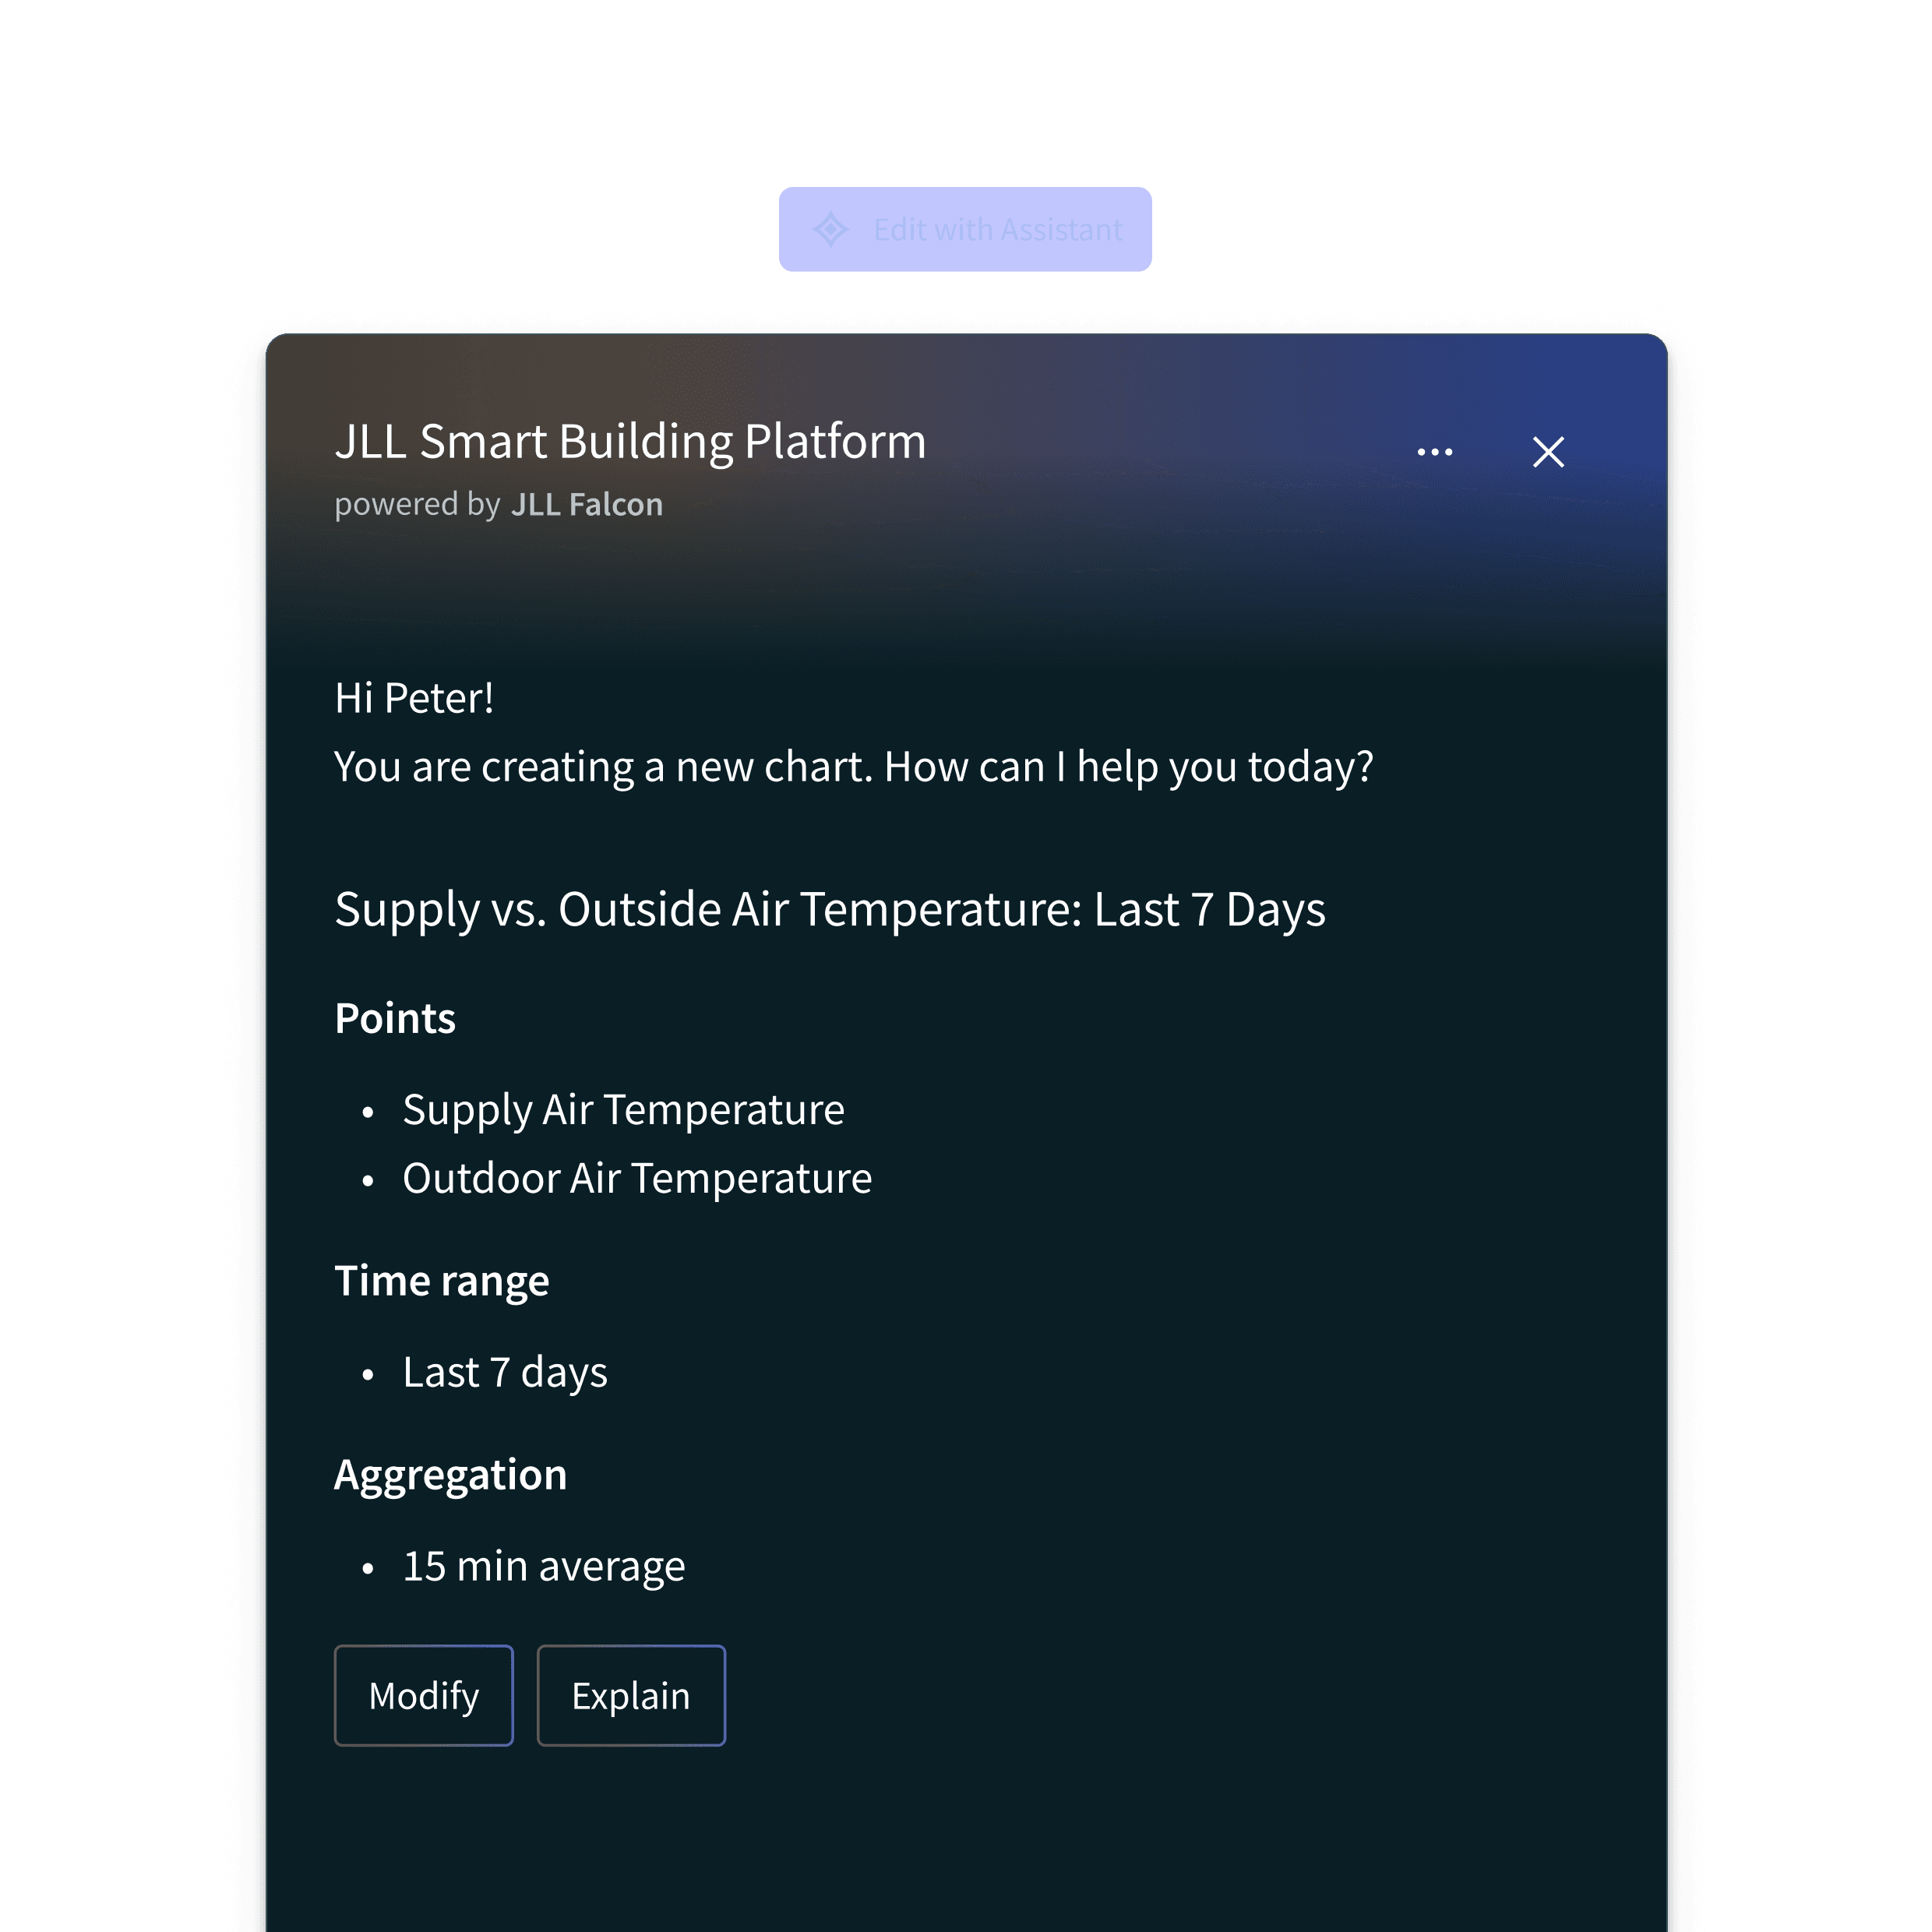
Graph Builder AI-assisted chart creation

AI Chart Assistant

Create a chart with a natural-language prompt instead of manual setup.

Try the prototype

Select points, build a chart, or ask the AI assistant.

This prototype is available on desktop-sized screens.

Key decisions

Two ways to express intent within one analysis workflow

Support different goals with a shared system

Operations, Real Estate, and Facility teams needed different analyses of the same building data. I combined more than 15 requirements into a workflow for selecting data, creating charts, and saving, sharing, or scheduling the result.

Make AI proposals inspectable

Manual filtering and contextual defaults supported selection across more than 900 data points. The AI-assisted path exposed chart type, selected data, and timeframe before execution, allowing users to review what would be created.

Representative interaction

Manual selection and AI assistance converge on a chart the user can inspect and refine.

  1. 01

    Express intent

    Select and configure data manually, or describe the analysis through the AI-assisted workflow.

  2. 02

    Review the setup

    Check chart type, data points, and timeframe. Automatic granularity changes accommodate data density.

  3. 03

    Reuse the analysis

    Save or share charts and schedule recurring exports, with clear expectations for asynchronous processing.

The 50% faster report-creation figure is based on limited usability testing of selected reporting tasks and Operations team estimates.

Graph Builder for Data Analysis

Data VisualizationAnalysis ToolsEnterprise SoftwareAI-Assisted Features

Designed a self-serve analytics experience that helped operations, real estate, and facility teams turn complex building data into charts, reports, and recurring insights.

Role

Product Design Lead

Product Name

JLL Smart Building Platform 2.0

Collaborated with

Product Management, Engineering, and Operations

Timeline

4 weeks (February 2026)

Deliverables

Product strategy, user research, information architecture, data selection, chart creation, scheduled exports, AI-assisted workflows, and code prototypes

Problem Statement

  • Operations, Real Estate, and Facility teams relied on fragmented tools and manual workarounds to access the same building data for different purposes.
  • Finding the right data, configuring charts, and recreating recurring reports required specialist knowledge and repeated effort.

Context

  • The goal was to create one flexible analysis experience that could support operational investigation, portfolio reporting, and equipment diagnostics without building separate tools.
  • The core challenge was making hundreds of data points understandable while working within strict limits for data volume, granularity, and asynchronous processing.

Responsibilities & Contributions

  • Defined a shared analytics model: Synthesized more than 15 requirements across three user groups into a prioritized workflow for creating, saving, sharing, and scheduling analyses.
  • Designed data selection at scale: Created filtering, contextual defaults, and point-selection patterns that remained usable across individual buildings and portfolios with more than 900 available data points.
  • Connected analysis to recurring work: Structured My Charts, shared charts, scheduled exports, and export history as one system rather than separate features.
  • Translated technical limits into product behavior: Worked with Engineering to design automatic granularity changes, asynchronous exports, and clear timeframe guidance without exposing backend complexity.
  • Made AI assistance transparent: Designed a conversational workflow that showed the proposed chart type, selected data, and timeframe before execution, giving users control over the result.

Impact

50% faster report creation

Based on limited usability testing of selected reporting tasks and Operations team estimates.

3 user groups

Supported operations analysis, portfolio reporting, and equipment diagnostics within one shared experience.

900+ data points

Made cross-building data selection manageable through filtering and contextual defaults.

Recurring exports automated

Replaced repeated manual data pulls with saved configurations and scheduled delivery.

Key Insights

  • A shared tool does not require a shared mental model. The experience succeeded when each user group could enter through its own goal while relying on the same underlying system.
  • AI assistance became more trustworthy when it showed its proposed output. Making chart type, data selection, and timeframe visible gave users a clear opportunity to review the result.

Critical Constraints

  • Data density required automatic granularity changes. The interface needed to explain why detail changed across time ranges without making performance constraints feel like arbitrary restrictions.
  • Charts and exports supported different processing limits, so the experience needed clear expectations for what users could view immediately and what required asynchronous processing.
Previous
Next