Energy use intensity
Trailing 7 days · 455 Market
48.6kBtu/ft²
−4.2%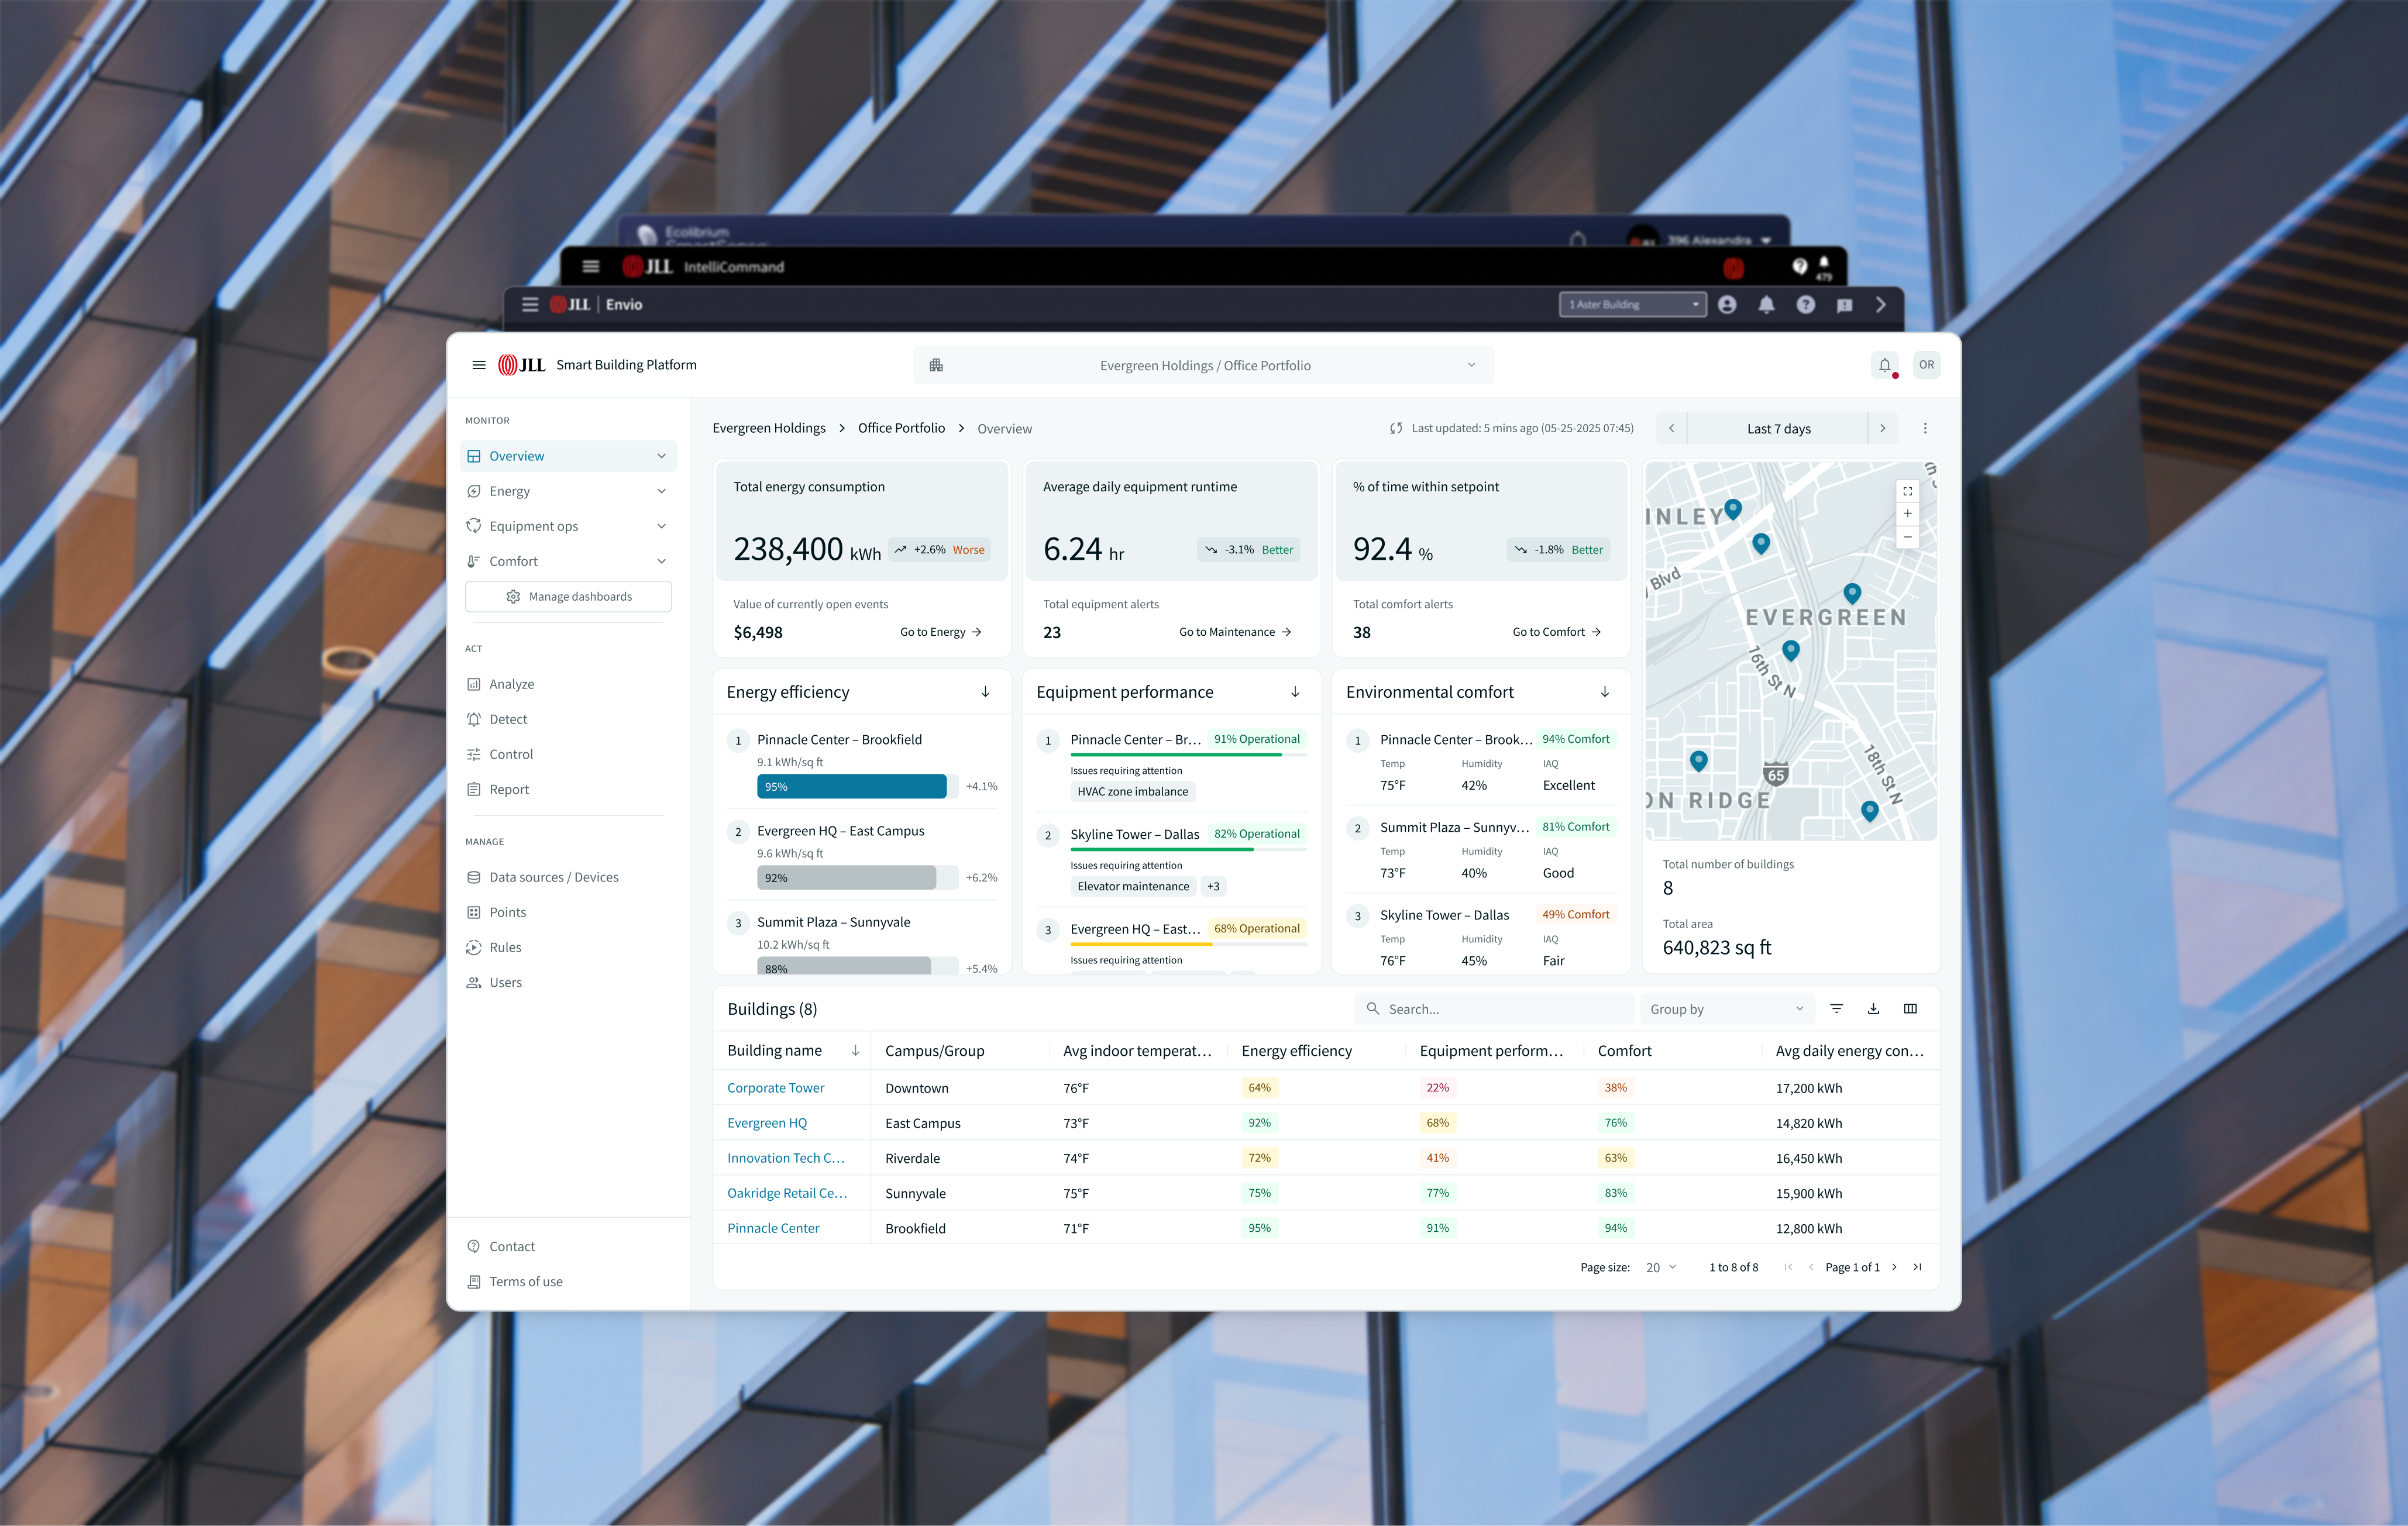
Select a widget to preview the consolidated component set.
Trailing 7 days · 455 Market
48.6kBtu/ft²
−4.2%Today 14:15 PDT
1.84MW
+6.1%Occupied hours · HVAC
92%
+2.8%Showing KPI Metrics.
Modular widgets that carried specialized workflows into one platform.
Key decisions
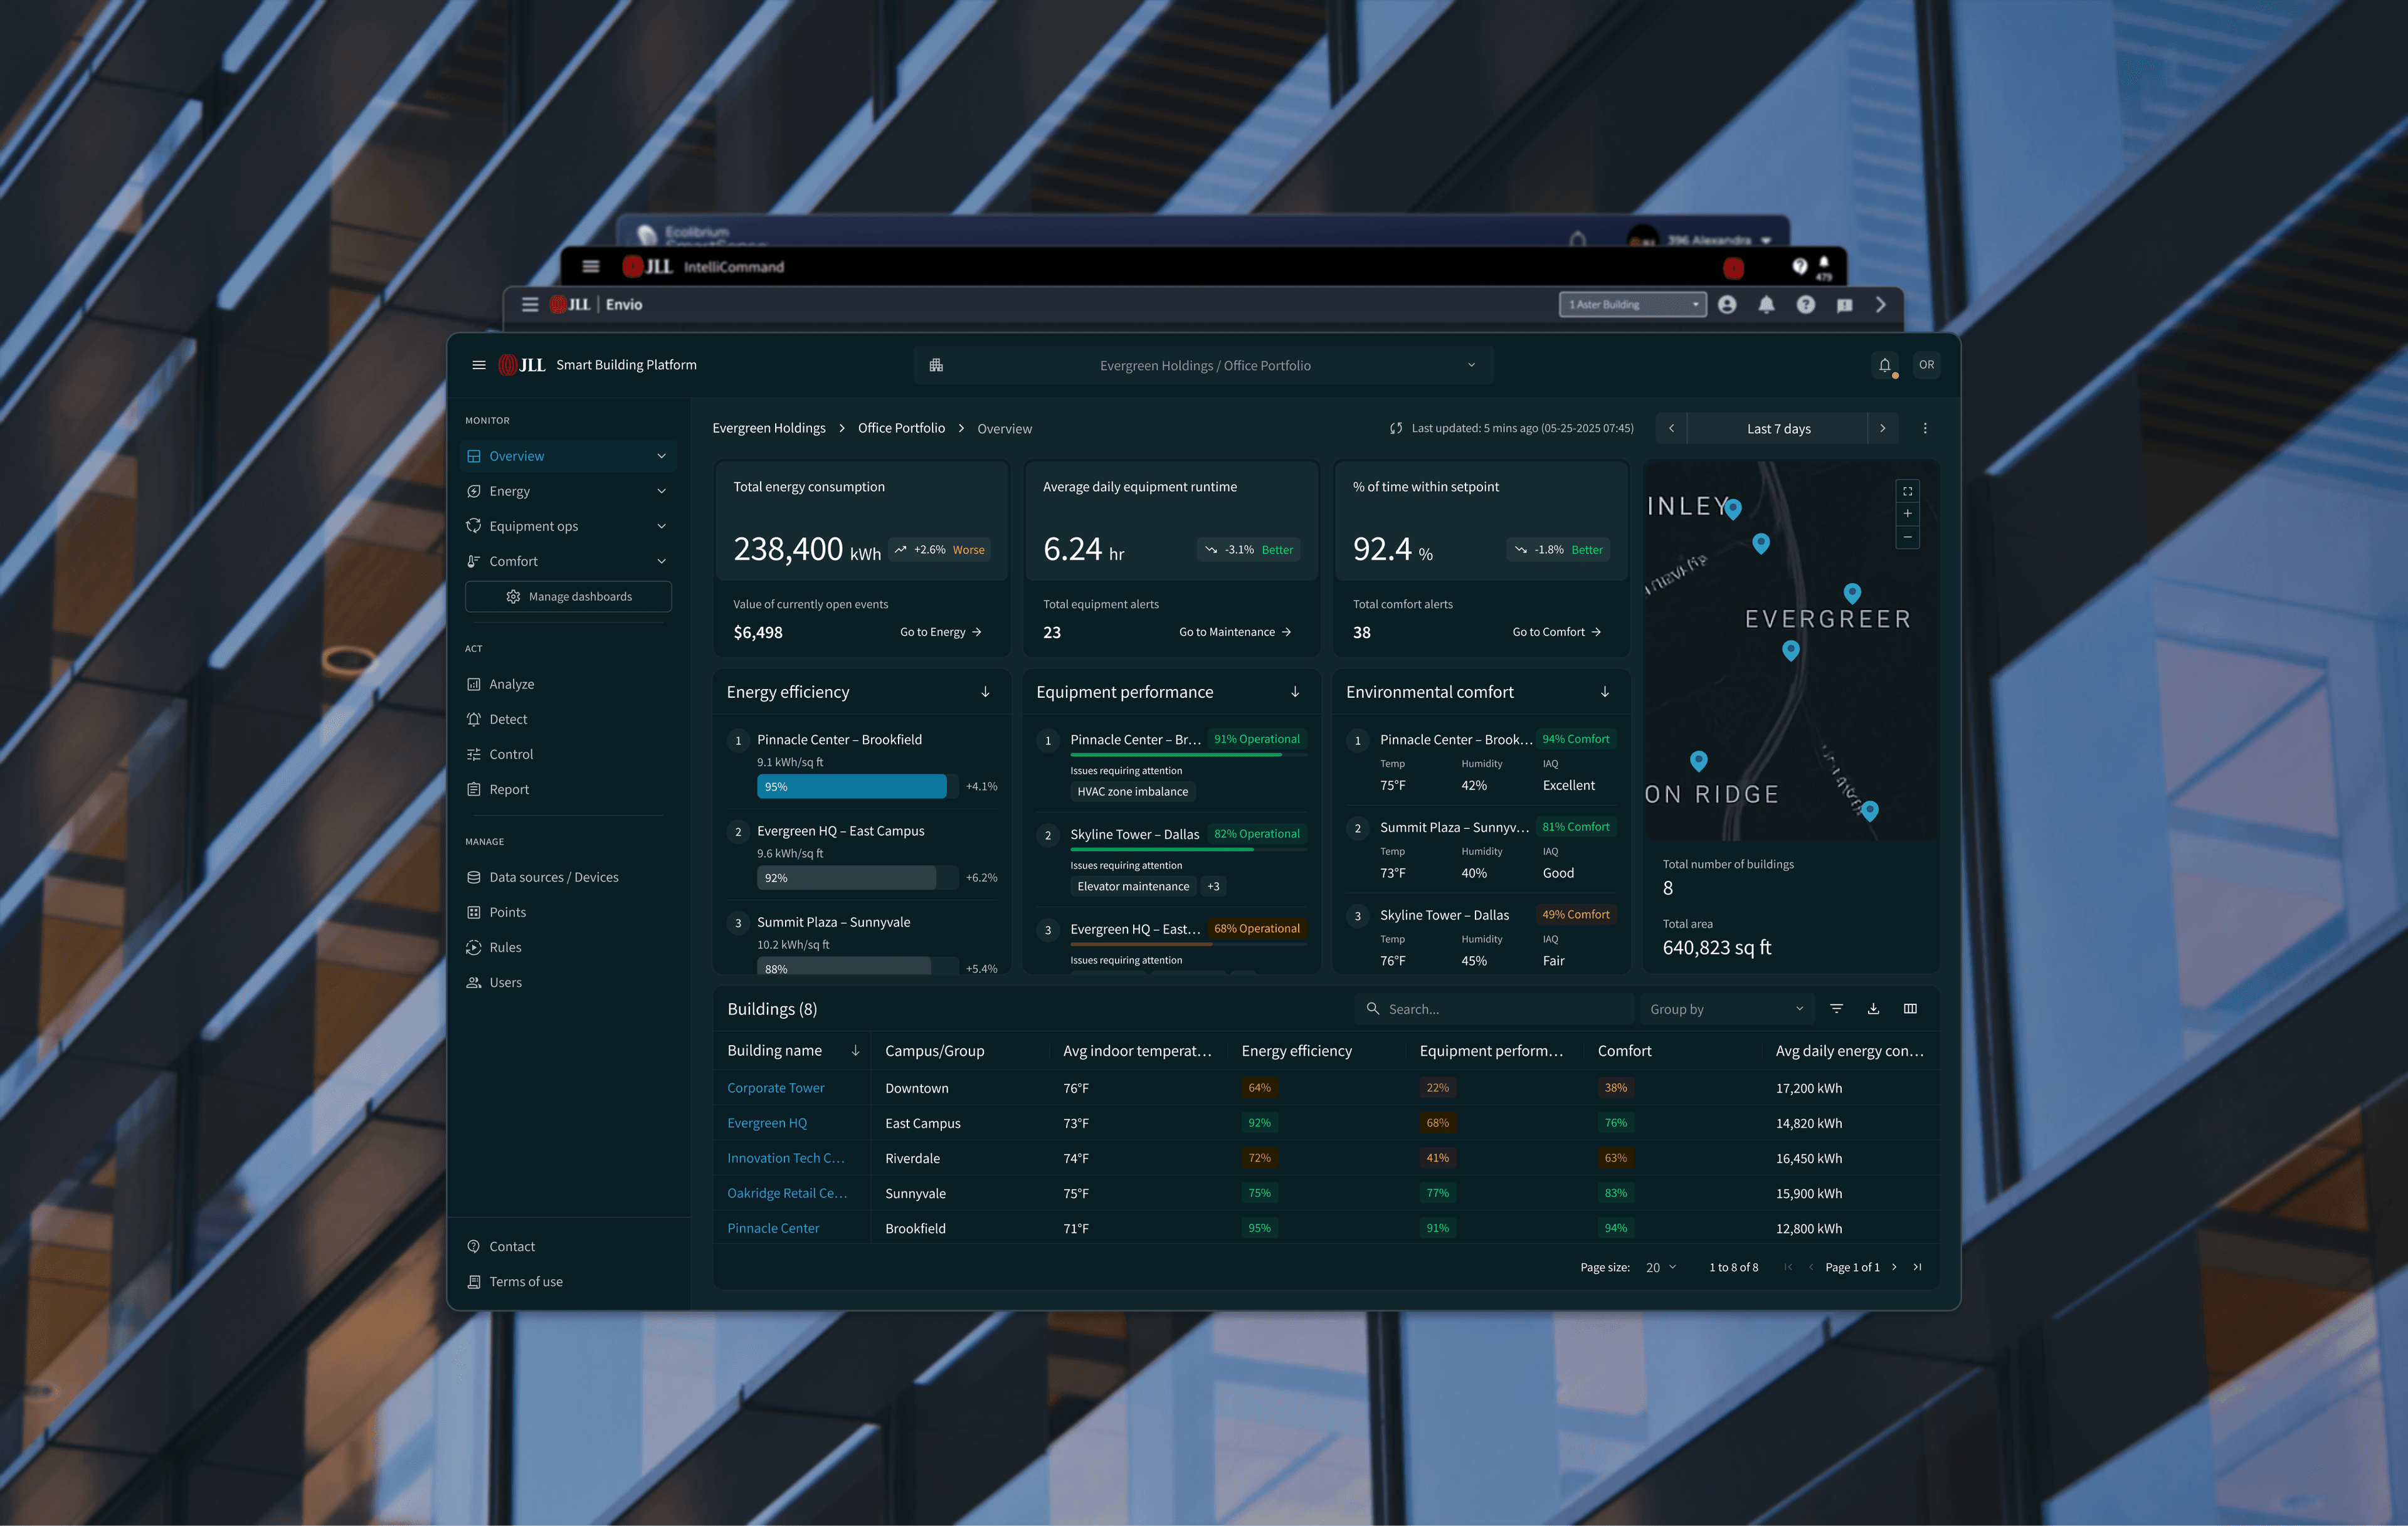
Three products brought different categories and operational models. I aligned requirements around Monitor, Act, and Manage so users could navigate by their task rather than by the product a capability came from.
Common navigation, dashboard widgets, and interaction patterns gave teams a shared foundation. Equipment control, analytical investigation, and portfolio monitoring retained their specialized workflows. Different technical foundations required phased migration.
The shared model connects monitoring, operational action, and configuration. The IA map and widget examples above show how this structure becomes an interface.
Use configurable dashboards and reusable widgets to understand energy, equipment, comfort, and portfolio health.
Investigate data, review events, or adjust setpoints through workflows grouped around operational action.
Configure schedules, rules, users, and data sources within a common management area.
Outcomes reflect selected workflows in limited usability testing and Product and Engineering team estimates, rather than a platform-wide controlled study.